Quantifying the Behavior of the Markets
EMH, the Efficient Markets Hypotheses, assumes that all investors are rational and behave rationally so that the market, at any one time, always prices assets in such a way that one could only get a return proportional to risk.
Many professional investors today have been brought up on EMH and its main application, the capital asset pricing model (CAPM) with its alpha and beta, the first measuring the “value added” by smart investing and the second an attempt to describe how a security moved versus the market.
Today, EMH is under a severe critical review with many wanting to jettison it. Indeed, EMH has been under attack these last twenty years or so but, like many paradigms which take hold of any discipline, its adherents, having invested much time and money in its propagation, set up a staunch defense. Any time that a serious objection was raised it was turned into a “new”, previously unrecognized risk, the most notable being the “small firms effect” (“Sure, small firms outperform, but they carry greater risk…”, you get the drift). Objections were co-opted into EMH which continued to grow fatter and thrive.
Today, the EMH ship has so many holes, so many people have made fools of themselves, so many people lost money, that there are not enough fingers to stem the jets streaming in from the frozen waters below. And EMH – that perfect mental construct with such elegant mathematics – is sinking.
The King is Dead, Long Live the King
To be replaced by what? The most promising contender seems to be behavioral finance, a group of theories spawned by the application of psychology and sociology on traditional finance, a cocktail of the soft social sciences, albeit most of its claims are already being tested and re-tested with high powered statistical tools.
For quite a number of years now, behavioral finance lurked in the shadows, a Cinderella amidst the stage curtains; I venture to suggest two reasons for this – first, quantitative-oriented finance types found it too soft, and, second, the disparate and dispersed nature of the subject made it difficult to grasp. I took to it like a duck to water but I recall one of my finance students complaining, after reading a couple of books and various papers, “I can’t figure out where this BF starts and where it finishes”. Many found it to mushy, with too many fingers coming out of its octopus-like structure.
In 2006, when I decided to refocus my career – I had been a provider of investment services for twenty years and now wanted to concentrate on what I liked best, namely, investment management and writing – I took on a book writing assignment and started work on “Behavioral Technical Analysis”, to be published in December 2009, which consists of two parts: first, a concise and practical introduction to behavioral finance and, second, informing readers how behavioral finance is being combined with technical analysis, a combination which is showing great promise.
One of my objectives in writing this book was to classify the material into categories so that it made sense to the reader. I came up with what I call the CPA-SSG framework and I managed to hang all the important behavioral finance concepts I could think of on these six headings. I try to show how behavioral finance really deals with problems caused or related to: Complexity in the world around us, Perception, Aversion, the Self, Society, and Gender. Grouping the main concepts in this way, pre-publication readers found, helps relate behavioral finance concepts to real world problems.
When I was learning about EMH and for many years thereafter while reading investment papers with pages full of arcane mathematics I used to pinch myself and try and keep focused by reiterating: (1) “Paul, we learn about investments to have a better than a monkey-hits-dartboard chance of making a profit”, and (2) “Is what you are puzzling over right now conductive to this?” I found, at my cost, that elegance is one thing, usefulness quite another. Similarly, I realized, at about the same time, that what we read about in the financial press (usually conjectures related to the fundamentals) is one thing; what the market does is another.
Some Things I Think I Learned
Over the years, thinking about the behavioral aspects of markets and my own investment experience made me realize various other things.
First, fundamentals and financial analysis may be great to make you feel like you’ve done all your homework and sometimes actually work in the long-term but, in the short-term, I realized I needed something to supplement the fundamentals. Even if you are a long-term investor, when you are reading an analyst’s report you have to keep in mind that there’s many a slip between the cup and the lip! By the time, the fundamentals get a chance to play the role you figured they’re going to play, there’s likely to be other news and the circumstances would have changed. I therefore needed something more imminent and relevant and so I went to technical analysis. Besides, when analyzing big, complex companies, such as banks, very few people, most often all of them insiders, have an idea of all that’s in the pot. With time you learn not to trust, except on the micro-level, and then only certain people, on occasion.
Second, most of the stuff in technical analysis books is subjective and has never been scientifically tested. I spent a lot of time testing many of the patterns which are supposed to work most of the time and, often, I found that some of them work some of the time. Technical analysis needs another dimension. And technical analysis has to be subjected to rigorous statistical testing if it is to enhance its usefulness and status as an investment subject.
Third, in my opinion, the dimension that technical analysis needs is made up of statistically tested and verified behavioral finance observations. In the book I go into some detail of aspects of technical analysis which have solid behavioral finance foundations and which, I found, can be turned into profit. At the end of this article I will briefly look at another.
I also realized that perhaps the best way to understand what is happening in the market is by side-stepping the question as to whether investors are rational or not and to look at what they actually do. This led me to the study of market dynamics which is covered in the book but which I will summarize here.
Market Dynamics
I classify investors into three types: trend followers, contrarians and the undecided. The trend can be up, down or sideways (also called “trading”).
At any point in time, each of these three types can either be participating or sitting on the sidelines with the intention of participating in the market at some time in the future (otherwise he or she is not really an investor).
Each participating investor can be either long (that is, paid out money and acquired the asset) or short (that is, received the money by selling a borrowed asset).
At any time, there is conversion between the three types of investors and there are transactions. For example, the market is trending up and I think that the market is likely to continue up so I bought an ETF for that market. I am therefore a participating trend follower with a long position. I continue to watch the market and I see some bad news and get cold feet and have doubts about the upward trend. I sell the ETF and I become a non-participating undecided since I do not have any opinion one way or the other. I sleep over it and study the market some more. I cannot come to a conclusion but the market opened strong and I do not want to miss out, so I buy into the market via the ETF again. I am a participating undecided investor with a long position. (Note that my hold is tenuous now compared to what it was when I believed in the uptrend: one hiccup and I am outta here.) Three days later I get it in my head that the market will fall any time now. I sell my ETF at a profit. I then short the same ETF, thus becoming a participating contrarian with a short position. And so it goes on…
We can construct a matrix like this, nine combinations in all:
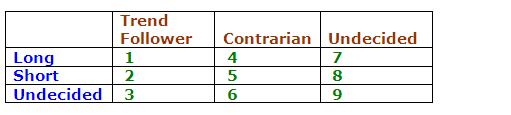
This is a rather unconventional approach but I found that thinking about the market in this way helps me a lot in trying to figure out what is happening. Price and volume action usually give you hints as to which type of investor is dominant.
The so-called risk premium exists because there is surprise after the event: winners are pleasantly surprised while losers are disappointed. Winners guessed right; losers guessed wrong.
For example, a participating trend follower with a long position makes a profit if a market continues up while a participating contrarian with a short position makes a loss.
As we know, on opposite sides of each of the billions of transactions which take place every day there is a genius and a schnook.
Bull, Bear or Dunno
Various researchers publish surveys of bulls and bears in the market. I know of a service, that by Birinyi Associates Inc, under Ticker Sense, which goes one further and provides timely information on the sentiment of “prominent investment bloggers” about the “outlook on the S&P500 for the next 30 days”, which includes Neutral along with the Bullish and Bearish. I find this survey very helpful because it goes half way to what I want to know.
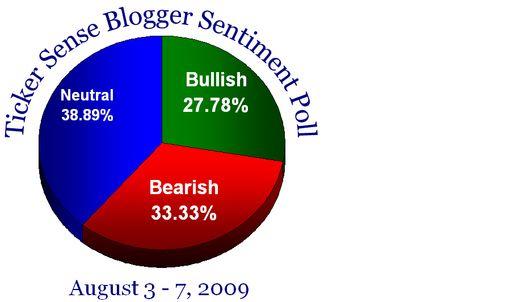
Source: Birinyi Associates, Inc.
Why only half way? Take “bullish”, for example. What does it mean when a blogger says he or she is bullish? As I understand it, that the S&P500 will be higher than it is today in 30 days time (although it can also mean the S&P500 being generally above what it is today over the next 30 days, because what if it is lower for 29 days and then spikes up on the 30th?). But, importantly, what my matrix requires me to know is (1) what the trend was when the blogger was asked his opinion (I can find this out but would not be certain I am seeing what he was seeing if only because I would have the benefit of hindsight), and (2) whether this bullish blogger has a position or not and, if so, whether it is a long or a short position (I cannot find this out).
So, rather than “bullish”, I like to ask a responder: (1) what do you think is the trend?, (2) do you think you should follow this trend, or go against it, or stand aside?, (3) are you participating, (4) if you are, are you long or short?
In interpreting the news, therefore, I try to form an idea of the 3-by-3 structure shown in the matrix, where the retail investors are, and where the institutions are. These considerations give me a much better feel of the market and where it might be heading.
A better feel, yes, but never expect any method or approach to pack the market in a box down pat !
One Thing Which Seems to Work
One thing that seems to work is that the market is like a pendulum: a trend forms and continues until it goes too far, bends, and a trend in the opposite direction takes its place. George Soros explains this pendulum action brilliantly in his various books.
A trend will continue only if it is feeding off converts – that is, as long as new investors are joining the trend, maybe because they burnt their fingers betting against it, the trend continues. The trend will end when there are no new converts.
When all the investors in cell numbers 2, 3, 5, 6, 8 and 9 convert to cells 1, 4 or 7, the trend is in its death throes.
Paul V. Azzopardi is an investment counsel and manages a private fund. He provides a free blog to investors wishing to manage their own ETF portfolio at ETFinvestmentsNewsletter.com. Paul has worked in the securities industry for the last twenty years as a manager of private client accounts. Paul has just finished writing a book on behavioral finance, Behavioral Technical Analysis, which is due to be published by Harriman House in the UK. His first book, Investment and Finance – A Common Sense Approach, an investment primer, was published in 2004 by Progress Press.