Rally Still Needs Better Breadth And Leadership
Two
weeks ago we noted that bearish breadth had peaked and turned, and
last week we suggested that we were probably at the start of a rally that would,
at the very least, relieve oversold levels that reached bottoming zones across
the board and may be the start of something more lasting.
We also included a list of breadth indicators to watch, which again
appear below, before we would become more aggressively bullish.
And we encouraged investors to watch for real indication of leadership —
many close to fuel stocks breaking out of sound bases.
While the rally continues, breadth and leadership still need significant
improvement for this rally to become something other than temporary.
Let’s review our breadth indicators with some comments:
          Â
1) A day when up-volume outnumbers down-volume by at least 9 to 1.
So far we’ve had 4.88 and 2.68 levels over the latest week, which are not
even close.
          Â
2) Five-day up-volume is 77% or higher of the total volume for the last
five days. The current figure is 54%, far
below what is needed.
          Â
3) Either the 10-day A/D is 2 or greater, or the 11-day A/D is 1.9 or
greater. So far the 10-day A/D has risen
to 1.4, while the 11-day has risen to 1.34 — still far below levels needed.
          Â
4) The S&P rises by 2.75%, and 70% or more issues advance.
We did have 74% of issues advance on 9/28, but the S&P only rose by
2.2%. Today, 68% of issues advanced and
the S&P was up 1.16%. We’re getting
closer, but are not yet there.
          Â
5) O’Neil’s follow-through days develop on several indexes at a time on a
given day and volume is clearly at a relatively high level in all those indexes.
Here, we’ve had one day when nearly all indexes had good follow-through
days on high volume. We’ve had minor follow-through
days by one index a few times since the low, and only one distribution day, so
we suspect we’re in rally mode until either more breadth shows up on the upside,
or a couple more distribution days indicate that we’re heading for a retest of
the lows.
          Â
6) Either the 15-day EMA (of advances – declines) reaches +300 or higher,
or the 8-day EMA (of advances – declines) reaches +400 or higher, or the 6-day
EMA (of advances – declines) reaches +500 or higher.
Here, EMAs are barely in positive territory or are still in negative
territory for the longer EMAs — not remotely close here.
To
repeat, the one thing more important than the above breadth indications is
leadership. IF we start getting lots of
valid breakouts of four-plus-week consolidations (flags or cup-and-handles) of
up-fuel stocks that are making our Top
RS/EPS New Highs list in leading groups, THEN we will be steadily increasing
our allocation to the long side — whether breadth signals a typically strong
bull market or not. Let’s watch carefully
and see what the market will give us.
In
the meantime, we continue to suspect that a sustained
rally is unlikely until economic growth is more assured and the uncertainty over
the War on Terrorism is more clear. Â
So
far we have neither the breadth indications nor leadership indications that a
sustained uptrend is in the making. But
the market has reached historically oversold levels and a bounce lasting weeks
to months is likely. Remember that with
this much uncertainty in the market, sentiment can change from bullish to
bearish on a dime — or on any shift in news. Â

Unfortunately,
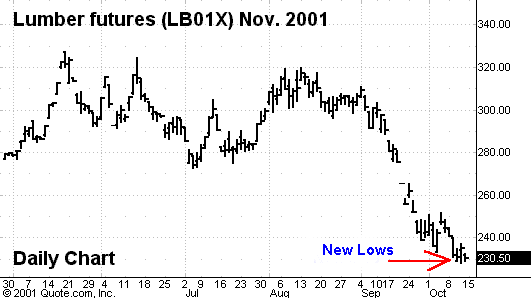
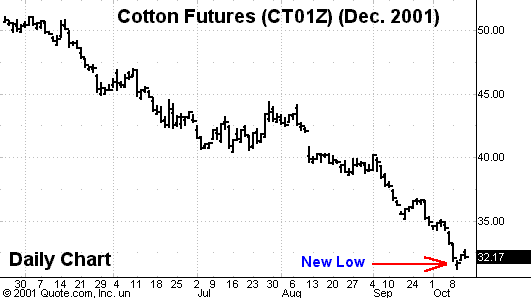
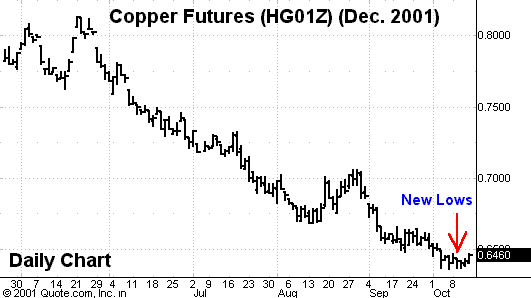
economically sensitive commodities remain clearly and universally bearish.
Copper, cotton and lumber all made new lows, while bonds made new highs.
Commodities are still discounting recession with no recovery yet in
sight. We suspect a sustainable
rally in stocks will not develop until we get clear bottom formations and upside
breakouts in copper, lumber and cotton, and U.S. bonds begin to top out and
break down. Right now these markets are
continuing to discount further economic weakness.

Let’s
look at the breadth numbers on our lists for the week.
Top
RS/EPS New Highs vs. Bottom
RS/EPS New lows for the latest week were 24/12, 14/14, 18/12, 13/15 and
12/8. Breadth is trading-range indicative
with no clear dominance by shorts or longs and neither showing 20 or higher
consistently on the week. Breakouts vs.
breakdowns of four-plus-week consolidations on our lists for the week were 3/2,
2/2, 1/1, 1/0 and 3/1. We had one close
call on the upside and one on the downside — both were not quite in leading
industries on the upside and downside, but came close.
But these breakout numbers are not even close to what we would expect on
a daily basis on the upside if this rally is to develop the leadership typical
of a sustainable up-move. Developing many
breakouts of nearly up-fuel criteria stocks is the most important component of
determining whether this rally is playable or not.
Today’s (Wednesday’s) leadership was full of laggards — we need real top
RS leaders to pull the market higher in a sustainable fashion.
Some medical device stocks look like a potentially leading group, as well
as some financial groups — but so far clear and strong leadership is lacking
from this rally.
Our
overall allocation is now DEFENSIVE, with 92% in T-bills awaiting new
opportunities. Our
model portfolio followed up weekly in this column ended 2000 with about an 82%
gain on a 12% maximum drawdown,
following a gain of around 41% the prior year. For
year 2001, we are now up about 14%, with a heavy cash position.Â
For
those not familiar with our long/short strategies, we suggest you review my
10-week trading course on TradingMarkets.com, as well as in my book The
Hedge Fund Edge, course “The Science of
Trading“
and new
video seminar most of all, where I discuss many new techniques. Basically, we have rigorous criteria for potential long stocks that we
call “up-fuel,” as well as rigorous criteria for potential short
stocks that we call “down-fuel.” Each day we review the list of new highs on our “Top RS and EPS New
High list” published on TradingMarkets.com for breakouts of four-week or
longer flags, or of valid cup-and-handles of more than four weeks. Buy trades are taken only on valid breakouts of stocks that also meet our
up-fuel criteria. Shorts are
similarly taken only in stocks meeting our down-fuel criteria that have valid
breakdowns of four-plus-week flags or cup-and-handles on the downside.
In an environment unclear directionally, we also only buy or short stocks on
leading or lagging industries according to our group and sub-group new high and
new low lists. We continue to buy new signals and sell short new short signals until our
portfolio is 100% long and 100% short (less aggressive investors stop at 50%
long and 50% short). In early March
of 2000 we took half profits on nearly all positions and lightened up
considerably as a sea-change in the new economy/old economy theme appeared to be
upon us.
Upside
breakouts meeting upfuel criteria (and still open positions) so far this year
are: American Home Mortgage Holdings
(
AHMH |
Quote |
Chart |
News |
PowerRating)
@20 (19.18) w/16 ops. Continue to
watch our NH list and buy flags or cup-and-handle breakouts in NH’s meeting our
up-fuel criteria — but continue to add just two per week, and only in
leading groups. If we get two or more
of the above breadth criteria for the overall market developing from here on,
we’ll then drop the “two per week only” advice on longs — but until
that develops, let’s remain somewhat cautious.
On
the short side, this year we’ve had breakdowns from flags (one can use a down
cup-and-handle here as well) in stocks meeting our downfuel criteria (and still
open positions) in: Phelps Dodge
(
PD |
Quote |
Chart |
News |
PowerRating) @38.1
— now take profits (28.51). Continue to
watch our NL list daily and to short any stock meeting our down-fuel criteria
(see 10-week trading course) breaking down out of a downward flag or down
cup-and-handle that is in a leading group. The
oversold nature of the market leads us to suggest that investors remain
cautious by only adding two shorts in a week.
We
still suspect that either new lows or a retest of recent lows will develop over
the next 10-20 weeks until solid evidence of recovery begins to emerge.
But let’s let the market show us with breadth and then leadership
measures if a really playable rally can materialize off of this fall’s lows.
Until we get a couple of breadth indications or handfuls of valid
breakouts of four-plus-week consolidations of up-fuel stocks daily, the benefit
of doubt belongs to the bears and to being cautious.
Let’s be patient and watch what happens with the recession and new war on
terrorism, while paying super-close attention to clear market reactions to
events and to internal market dynamics.
Â
Â
          Â
