Real estate ETFs rolling over
Stocks followed up the previous day’s rally with another session of gains, but an afternoon sell-off minimized the market’s advance. The S&P 500 gained 0.2%, as did both the small-cap Russell 2000 and S&P Midcap 400 indices. The Nasdaq Composite and Dow Jones Industrial Average each closed 0.4% higher. The Nasdaq was showing a 1.1% gain at its late morning peak, but the bears took control in the afternoon and eroded a majority of those gains. With both the S&P and Nasdaq finishing in the bottom half of their intraday ranges, it sets a negative tone going into today’s session.
Total volume in the NYSE increased by 5%, while volume in the Nasdaq was 9% higher than the previous day’s level. Since the major indices all finished in positive territory, the gains on higher volume enabled both the S&P and Nasdaq to register a bullish “accumulation day.” In the NYSE, volume also popped back above its 50-day average level. When comparing the turnover of the morning rally with that of the afternoon selloff, it was positive that volume declined slightly as stocks were selling off. At mid-day, before the retracement off the highs began, volume in the NYSE was on pace to finish 9% above the previous day’s level. Market internals showed more strength in the Nasdaq, where advancing volume exceeded declining volume by a ratio of 2.2 to 1. But in the NYSE, advancing volume only fractionally beat declining volume.
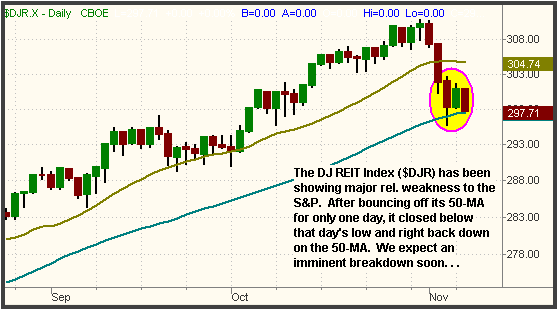
One sector that has begun rolling over and is showing a lot of relative weakness is Real Estate (REITs). There are several indexes that track the sector, but the most popular is the DJ Equity REIT Index ($DJR). Take a look at its daily chart:

Until the end of last month, the index was consolidating nicely at its all-time high, but it ran out of gas and failed its minor breakout attempt on October 31. From November 1 – 3, the $DJR index reversed sharply and lost a total of 3.9%. Comparatively, the S&P 500 fell only 0.9% during that same period. The index dropped to support of its 50-day moving average on November 3, which led to the usual reaction of a bounce the following day. If the sector’s correction was going to be short-lived, we would have expected the $DJR index to hold above the low of November 6, but yesterday’s action was ugly. After bouncing off its 50-day MA for only one day, the index immediately sold off and closed yesterday below its November 6 low. As you can see, the $DJR finished yesterday right at its 50-day MA. We feel the Real Estate sector could fall rapidly over the next week if the index fails to get back above yesterday’s high within the next one to two days.
We sent an intraday e-mail alert to subscribers yesterday, informing them we were selling short the iShares Cohen & Steers REIT (ICF), but there are several other ETF options as well. They are: iShares DJ Real Estate Index (IYR), Vanguard REIT (VNQ), and StreetTRACKS Wilshire REIT Index (RWR). All of them have a very similar chart pattern to the $DJR index, so take your pick. Note that if you attempt to sell short any of these ETFs, they may be on your broker’s “hard to borrow” list. This means your brokerage firm’s web site may initially tell you that shares are not available for shorting. But if this occurs, we recommend phoning your broker to specifically ask them to do a “locate” for shares of the ETF you are attempting to sell short. With a little push, your firm should easily be able to call around and get shares for you within a matter of minutes. Just a little advice for those of you who run into this issue.
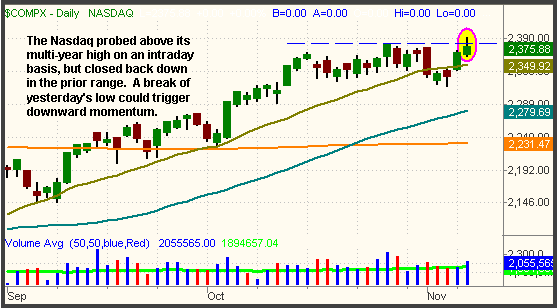
Yesterday, both the Nasdaq Composite and Nasdaq 100 traded at new multi-year highs on an intraday basis, but the afternoon selloff caused them both to close back within the range. If yesterday’s lows are violated, this could lead to a rapid selloff that often accompanies failed breakouts at pivotal highs. A break below yesterday’s low in today’s session should at least send the Nasdaq brothers down to test support of their November 3 lows. Beyond that, the 50-day moving average would be the next major area of support. The failed breakout to the new high is circled on the daily chart of the Nasdaq Composite below:

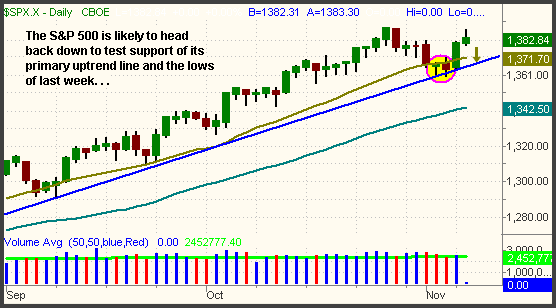
The S&P 500 and Dow Jones Industrial Average, both of which bounced off support of their multi-month uptrend lines yesterday, are poised to reverse back down to test the lower channel support of their trendlines.

We expect a re-test of the November 3 low in the coming days. If that doesn’t hold, be prepared for a move down to the 50-day moving averages in those indices as well.
Open ETF positions:
Long GLD, OIH, DBC, short ICF (regular subscribers to The Wagner Daily receive detailed stop and target prices on open positions and detailed setup information on new ETF trade entry prices. Intraday e-mail alerts are also sent as needed.)
Deron Wagner is the head trader of Morpheus Capital Hedge Fund and founder of Morpheus Trading Group (morpheustrading.com), which he launched in 2001. Wagner appears on his best-selling video, Sector Trading Strategies (Marketplace Books, June 2002), and is co-author of both The Long-Term Day Trader (Career Press, April 2000) and The After-Hours Trader (McGraw Hill, August 2000). Past television appearances include CNBC, ABC, and Yahoo! FinanceVision. He is also a frequent guest speaker at various trading and financial conferences around the world. For a free trial to the full version of The Wagner Daily or to learn about Deron’s other services, visit
morpheustrading.com or send an e-mail to
deron@morpheustrading.com
.
