Recent Action Is A Good Indication Of What’s To Come Next
Pre-market futures are slightly green
off the closing lows from yesterday afternoon’s sell off. The surge in volume on
downside breaks of support follows the usual pattern lately: markets rise on
light volume and sell on increased volume, a recipe for lower prices eventually.
ES (+$50 per index point)
S&P 500 covered roughly 17 points between cash
market bells yesterday. Now that’s more like it! I’m trading equal size in the
ES and ER these days, and was short from 1223 going into the afternoon session
yesterday. She caved in pretty good with methodical fashion, and my trailed stop
exit at 1215 still left another +6pts on the table from profit exit to session
lows. Oh well, chunks of profit from the midst of intraday swing moves never
catches every tick.
For today, we have clear resistance near 1215
again as 38% of yesterday’s range and near today’s pending pivot point. A break
above 1220 on a candle closing basis will likewise turn things bullish again.
Not likely in my opinion, but absolutely anything is possible in financial
markets.

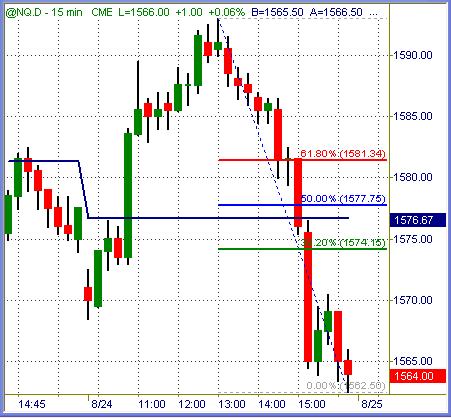
NQ (+$20 per index point)
Nasdaq 100 awoke from its coma and actually
spanned nearly 30pts from high to low. As a $600 per contract entire range, that
is still inside the ES intraday value and about 1/2 that of the Russell by
comparison. Still, there was lunch money to be made from those who trade this
plodding symbol.
Today’s layered resistance near 1574 is likely
to be tested, unlikely to be broken. A close above 1582 would have bulls back in
charge and shorts squeezed out of their drawers, which does not appear likely to
happen.
YM (+$5 per index point)
Dow Industrial futures covered a bit more than
$600 per contract from highs to lows. 10480 is also layered resistance while
10520 marks the top of bearishness and a return to bullish bias. I’d guess we
will see 10300 before 10500 again, but we’ve all been surprised by surprising
market action many times before.

ER (+$100 per index point)
Russell 2000 futures dropped from 664 highs to
653 lows, an $1,100 per contract move. 657 is the initial test for sell stops
clustered this morning, and it takes a break above 660 to push this tape back in
the hooves of bulls again. Small-caps and Mid-caps bounced slightly at the
close, where most of the momentum buyers continue to play.
The Russell 2000 and S&P 400 are two leading
hot-money indexes, and may test their 62% range values while other stodgy
symbols above falter near 38% values respectively. If we see this pattern unfold
again today, it would be sell signals across the board.

{Price levels posted in charts above are
compiled from a number of different measurements. Over the course of time we
will see these varying levels magnetize = repel price action consistently}
Thought Of The Day
I was long and short the ER (and ES) several times yesterday with
modest success heading into the afternoon session. Short the ES from 1223 never
wavered, but one short attempt in the ER at 662.50 got stopped out on that high
spike of the day. The index was still on sell signal confirmed via my method of
trading, so I shorted it one more time for the day at 663.00 next candle along.
While the ES continued to work its way slightly
lower, the ER kept bouncing between 662 and 663+ range. It acted like days
before where small caps popped into the closing bell while other indexes went
flat or lower. Toyed with my emotions, so to speak.
When the ER traded down to 660.20 I trailed my
stop from 664 to 661, locking in a nifty +$200 per contract profit. Sounds
great, to some traders. In my case the index came right back up to 661.00 one
last time, stopped me out to the very tick and almost immediately plunged below
657 in minutes flat.
I watched that event unfold with +$200 per
contract safely in the bank, but an eventual drop to 653 left another +$800 per
contract on the table. Obviously I would have captured it all, but trailed stops
would have taken me out near 655 or lower with relative ease.
Moral of the story? Late afternoon swings have
more directional potential than any other time of the day. I know better than to
crowd stops during this critical period of the session, especially when all
other indexes are working lower and only one of them hangs up. It was nothing
more than fear of loss taking hold of me when modest gains were flashed in the
account. For the past two sessions I had similar profits turn to dust as trailed
stops to entry were taken out. The first time I crowd a stop to prevent that
from happening again, I miss a solid chunk of the biggest move yet this week.
So it goes in light volume trading conditions.
Seemingly endless chop resolves itself in dramatic fashion when air pockets in a
chart get pushed thru like dominos. Profitable, but certainly not the easiest of
trading conditions for intraday players. That said, it sure is nice to see
normal intraday ranges once in awhile!
Trade To Win
Austin P
(free pivot point calculator, much more inside)
Austin Passamonte is a full-time
professional trader who specializes in E-mini stock index futures, equity
options and commodity markets.
Mr. Passamonte’s trading approach uses proprietary chart patterns found on an
intraday basis. Austin trades privately in the Finger Lakes region of New York.