Reflation: What It Means For You
This past
week, the major averages continued to try to break through
resistance levels though not all averages have yet cleared resistance hurdles.
The Naz
(
$COMPQ |
Quote |
Chart |
News |
PowerRating)made a new 52-week high, while the S&P
500
(
$SPX.X |
Quote |
Chart |
News |
PowerRating) is approaching its 52-week high. Technicals and fundamentals are
looking more positive, but are consistent with a mini-bull move and not a
multi-year bull market. Currently the VIX is near 20, a historical flashpoint
that the market is overbought and a correction is near, and if resistance is not
cleared quickly by most averages, a consolidation or correction is likely in the
near-term.
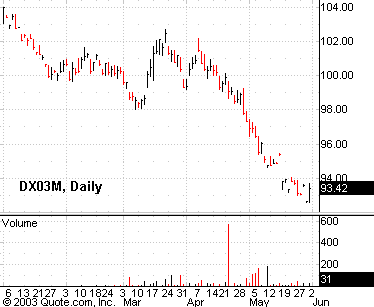
The dollar has weakened sharply
this year and this is helping to reflate the US economy, though mostly at the
expense of Europe. Global central
banks are reflating in unison, and even the moribund ECB is likely to cut rates
(probably by 50 bps) next week. A 50
bp ECB cut may put a temporary top on the euro if it develops, and the euro is
overdone in any event in the short-run against the dollar. Absent
a major shock, global concerted central bank reflationary efforts, increased
fiscal stimulus, and better consumer psychology along with the lowest interest
rates in 40 years, should push the US economy to accelerate SOME in the second
half of the year with increased corporate profits and increased business
spending on capital equipment. The
stock market should like these developments, though it is still way too
over-priced to launch a major new bull market.

In addition, global reflationary
policies are likely to be less effective than in the past because of lingering
deflation and massive global overcapacity problems that will take many more
years to work off. Reflation may
have a more muted effect on the economy, but is now likely to be felt by
inflationary gauges more than in recent years.
China has turned the corner and is now developing domestic inflation
which will feed through globally, much as it has exported its deflation in
recent years. This is why gold and
inflation hedges are perking up and may indeed be embarking on the beginnings of
a secular upmove.
This Fed has signaled that its
reflationary effort will continue until the economy recovers in a meaningful
way, COME WHAT MAY in terms of inflation. Stag-flation
may result and be the next impetus for a resumption of the secular bear market
in stocks down the road a ways. Absent
outright global deflation, global bonds are now in an unsustainable bubble and
are wildly over-valued and over-owned. While
they may show more short-term strength, investors should begin exiting bonds
quickly and should hedge for rising interest rates as more evidence of a
stronger economic recovery develops. If
inflation or stag-flation develop, the bond market will take a very large hit.
Investors should continue to
add stock exposure as trade signals are generated. A high-volume, strong
breakout of the major indices to new 52-week highs will turn us more
aggressively bullish. All of the conditions are in place for a stock market
rally; now we await market follow-through and breakouts of stock that meet our
strict criteria.
Since March 2000 the
world index is down over 41%, the S&P over 37%, the IBD mutual fund index is
down over 59%, and the Nasdaq has crashed over 68%. Meanwhile since March 2000
the long/short strategy we summarize and follow-up each week in this column has
made more than 44% on a worst drawdown of under 6%. While
this recent performance is under-performing our long-term investment returns,
and it is hardly thrilling to have been so heavily in cash since March of 2000,
we have managed to eke out gains with very low risk in a very dangerous market
environment where 9 out of 10 traders have been big losers.
Our official model portfolio
overall allocation remains SOMEWHAT DEFENSIVE. We’re now 32% long, with 68%
cash in T-bills awaiting new opportunities. Our model portfolio followed up
weekly in this column from 1999 through May 2003 with specific stop and entry
levels was up 41% in 1999, up 82% in 2000, up 16.5% in 2001, and up 7.58% in
2002, and up 4.03% through May 2003 an average annual gain of over 31%
with no losing year — all on a worst drawdown of around 12%. As
of May 29, 2003 we’re up 4.02% for the year 2003 (taking into account the
correction in the stop-out of STHLY indicated below) and will be no longer
publishing a track record of specific entry/exit/ops levels as we discuss below.
STHLY
Trade Revision from Last Week
Many apologies to all
of our weekly followers, we were indeed stopped out of Stet
Hellas Telecommunications
(
STHLY |
Quote |
Chart |
News |
PowerRating) @8.64 (9.19) (Out on 8.2 ops
at 8.01). I was out of town last week, and one of my associates printed the
article. However, traders should note that one cannot use actual stops in most
Naz issues like STHLY. Therefore when our funds received the alert that STHLY
hit our theoretical stop level, they did what they usually do — see if STHLY
makes a new low before liquidating once the alert stop level is hit. Since the
initial low was never violated, we didn’t exit the position. And since we
didn’t exit the position, our employees assumed that we would stay long in the
model portfolio.
However readers are
correct that the STHLY should have been exited on the theoretical stop as that
level was hit, and we apologize for not recording it properly. It has been
corrected in this week’s column.
The STHLY situation
though, reveals a developing problem with the exact recommendations we follow in
the model portfolio of TradingMarkets.com with an increasingly large following.
While we list the trades that meet our rigid criteria in the column with exact
entry and stop levels for investors striving to follow our methodologies as a
rough benchmark of what someone following our methodologies would do and as an
illustration, it has increasingly come to our attention that a growing number of
traders are simply trying to emulate our trades and stop levels exactly. This
wasn’t our intention and it isn’t fair to those whose money we manage, our
primary business. Nor was it our intention to have traders accuse us of trying
to mislead anyone by publishing these trades in the most realistic fashion we
could.Â
We appreciate it when we make an error in these trades and it is pointed
out as was the case with STHLY. Yet an increasingly large contingent of traders
seem to be missing the point that the trades are meant merely as a rough
benchmark. Whether you take some of the close calls or leave out some of the
exact trades that meet our rigid criteria, or whether you were stopped out of
one particular trade or not is not the point. The point is that generally, given
a year or more and a sufficient number of trades, most investors following this
methodology as carefully and fully as they can, will have very similar results,
though not necessarily the exact same trades. It is the ability to locate close
calls and valid trades and take selected trades in the leading or lagging
industries that will determine your success, not the exact trades you take. Many
have turned more of their attention to emulating exactly what we do, instead of
focusing on how close calls and valid trades by this methodology in general seem
to perform very well and merit some portfolio allocation, which is in fact the
real point.
We note that other
TradingMarkets.com articles do not list exact trades and only extra-fee services
come close to doing so. Our business is managing money, not a fee-based Internet
advisory. Therefore in future articles we will discuss what stocks meet our
criteria and follow a much more loose model portfolio of longs and shorts that
have met our criteria without any reference to exact entry prices, or stop
levels, or a track record, and leave this to those who are following our
methodologies. We’ve published exact trades since 1999 (when it was
Tradehard.com) and the archives of these trades are available to all those who
want to follow this long/short methodology. This trading history through bull
and bear markets should be sufficient for any trader really willing to go
through the work necessary to implement this methodology as one of those in a
trading portfolio. I honestly believe that I’ve gone further in revealing many
of the exact methods and exact trades these methods reveal than nearly any other
major money manager or hedge fund manager I know of. I hope you’ll agree.
So we will still list
stocks that meet our criteria and ones that are close calls from now on and let
those following our work determine the track record and the exact entry and
exits of those methodologies. Investors wanting more specific use of this
methodology can invest in one of the funds that follows these and many of our
other models and/or subscribe to our monthly letter, Portfolio Strategy Letter
(650-851-6846). We will continue to strive to help aid investors using our
techniques in these columns, just not with specific price and stop levels, which
seem to get many investors focusing on trivia instead of focusing on how to
improve their own stock selection and trading actions consistently.
Investors should note
that one of the keys to our avoiding negative periods has been our following of
the internal numbers in our own TopRS/EPS New Highs and Bottom RS/EPS New Lows
lists, which we publish daily on TradingMarkets.com.
Last week we had readings of 39, 45, 39, and 83 in our Top RS/EPS New
Highs list, accompanied by 4 breakouts of 4+ week ranges, NO valid trades and NO
close calls. Consistent readings
above 20 here signal that the environment is still one we should watch carefully
for new long-side signals. But the
lack of quality breakouts also signals that few new opportunities are developing
here yet — this will probably await a consolidation/correction or a solid and
clear breakout above resistance. Remain
on watch to become more aggressive with your stock selection once more positive
market breadth indicators appear, particularly a week with 20 or greater new
BREAKOUTS of 4+ week ranges in a week. Remember to try and position in valid 4
week range breakouts on stocks meeting our criteria or in close calls that are
in clearly leading industries, in a diversified fashion.
Bottom RS/EPS New Lows remained non-existent last week, as they have been
since mid-April, showing low readings of 1, 2, 1, and 2, NO breakdowns of 4+
week patterns and NO close calls, meaning the short-side is not developing here
yet.Â

For those not
familiar with our long/short strategies, we suggest you review my book The
Hedge Fund Edge, my course “The Science of Trading,” my
video seminar, where I discuss many new techniques, and my latest
educational product, and interactive
training module. Basically, we have rigorous criteria for potential long
stocks that we call “up-fuel,” as well as rigorous criteria for
potential short stocks that we call “down-fuel.” Each day we review
the list of new highs on our “Top RS and EPS New High List” published
on TradingMarkets.com for breakouts of four-week or longer flags, or of valid
cup-and-handles of more than four weeks. Buy trades are taken only on valid
breakouts of stocks that also meet our up-fuel criteria. Shorts are similarly
taken only in stocks meeting our down-fuel criteria that have valid breakdowns
of four-plus-week flags or cup and handles on the downside. In the U.S. market,
continue to only buy or short stocks in leading or lagging industries according
to our group and sub-group new high and low lists. We continue to buy new long
signals and sell short new short signals until our portfolio is 100% long and
100% short (less aggressive investors stop at 50% long and 50% short). In early
March of 2000, we took half-profits on nearly all positions and lightened up
considerably as a sea of change in the new-economy/old-economy theme appeared to
be upon us. We’ve been effectively defensive ever since.
Upside breakouts
meeting up-fuel criteria (and still open positions) so far this year are: — Garmin
(
GRMN |
Quote |
Chart |
News |
PowerRating); and Avid Technology
(
AVID |
Quote |
Chart |
News |
PowerRating);
and we have corrected the stop-out in STHLY ( on 8.2 ops at 8.01) and
CYBX was stopped out last week on 20.5 ops at 19.20.
We will now list all close calls and what we consider valid trades here
regularly without entry or stop levels. Investors
should focus on leading industries and stocks that are rigidly valid or close
calls in leading industries. Continue
to watch our NH list and buy flags or cup-and-handle breakouts in NH’s meeting
our up-fuel criteria — we’ll continue to advise adding only two stocks per
week that are in clearly leading groups until we get clear breakouts in all the
averages. Watch market action at current resistance levels as well as our Top RS
and EPS list for weeks with more than 20 breakouts of 4+ week consolidations for
confirmation of a market breakout from this consolidation period.

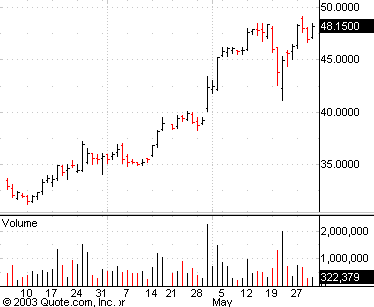
Daily
chart of Garmin (GRMN)

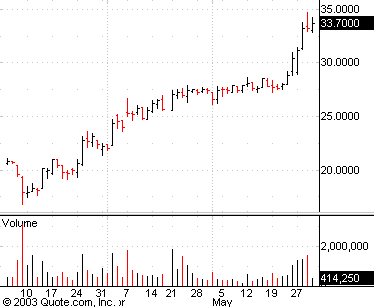
Daily
chart of Avid (AVID)
On the short
side this year, we’ve had breakdowns from flags (one can use a down
cup-and-handle here as well) in stocks meeting our down-fuel criteria (and still
open positions) NONE. Continue to watch our NL list daily and to short any stock
meeting our down-fuel criteria (see interactive
training module) breaking down out of a downward flag or down cup-and-handle
that is in a leading group to the downside but only add up to two in any week
(and only in the weakest groups) until we get better breadth numbers on the
downside and better leadership.
Investors and traders
should be excited about the environment on the long-side. However be patient and
be sure to only buy strong breakouts that meet all of our criteria. If indeed a
multi-month bull move is in the making, the best trades are yet to come, and
waiting for valid breakouts will allow you to substantially beat the moves of
the averages even though most trades come after the move is well on its way.
Investors are once again looking for a second half recovery, and any delay could
result in market apathy where the market range trades and never breaks major
resistance levels for a long period of time. We continue to watch for clear
leadership in leading new industries and plurality of breakouts in those
industries, for follow-through by close call and criteria stocks, for breakouts
by the averages that will confirm if this bear-market rally has legs, and for
further breadth thrusts, to tell us that a better bullish cycle is developing
here. We still suspect as we have
said for sometime that the current rally will be of stronger and longer duration
than any since the 99-2000 peak, but nothing like the bull markets of the 80’s
and ‘90’s. Better times seem to be materializing here with the weakened
dollar, low interest rates, increasing sentiment, and tax-cut stimulation. Now
corporate profits and capital investment must come through by meeting and
exceeding expectations.
Mark Boucher
