Remember What To Do In Bear Markets
The
major indices finished green for the second day in a row,
which we haven’t had since Feb. 14 and
Feb. 18, which was the day following the holiday. NYSE volume was 1.3 billion, a
volume ratio of 63, and breadth +608. The SPX
(
$SPX.X |
Quote |
Chart |
News |
PowerRating) gained +0.5%,
while the
(
QQQ |
Quote |
Chart |
News |
PowerRating)s advanced +1.6%.
Since making a swing
point low of 818.54 last Tuesday, the SPX has made three higher lows and highs,
closing Friday at 841.15, which is right on that magnet level discussed in
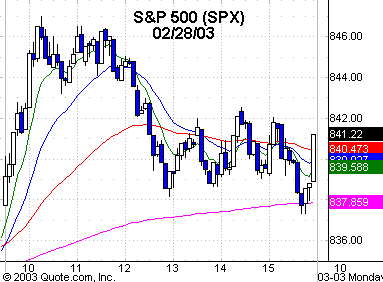
previous commentary. It is also right on its 20-day EMA, which is 843.14. At the
most opportune entry opportunity, which was in the .786 retracement zone of 808,
the SPX, the QQQs, etc., were extended to the downside and oversold. That is not
the case now, so there is no volatility decision to make from an extended
situation either way. The next change in direction is a close below the low of
the most recent high day, which is Friday’s low of 837.28. A continuation of the
short-term downtrend doesn’t occur until the last swing point low of 818.54 is
taken out.
If some early March money
gets put to work this week, the next resistance is from the 863 50-day EMA
through the 870 head-and-shoulder neckline for the SPX. The QQQs, as I said last
week, can run to the upper boundary of its down channel at 26. The .618
retracement to the 27.47 swing point high is 25.88, the .707 is 26.25, and the
.786 is 26.58. Certainly the 26 – 26.58 level is a zone with confluence. The
1,2,3 trend entry is above 25.37. The .382 retracement to 28.79 is 25.34 and has
been the ceiling for the past nine days after rallying off the .618 retracement
zone from a 23.32 low.
If there is any early
weakness this morning, I look to the 24.95 – 24.80 level for any longside
pullback setup. The futures right now are early green, so that probably won’t
play out early on. In tomorrow’s commentary, I will include several charts of
different intraday time periods depicting the same Trap Door trade and then a
1,2,3 higher bottom trade that followed. It will show you the benefit of also
looking at higher intraday time frames when you get into such choppy volatility
markets.
The
(
SMH |
Quote |
Chart |
News |
PowerRating)s had a
strong day Friday, up 3.5% following the up day on Thursday. Both days were on
the most volume since Jan. 30, so that’s a positive. They closed at 23.54, right
at the 89-day EMA of 23.70. The 50-day EMA is below at 22.95. Low to high, the
SMHs are +16% during this current short-term bounce. The SOX starts bumping
against its weekly down trendline at about 300 – 310. The SOX closed Friday at
297.63. Failure at this retracement level just above would indicate a potential
decline below the Feb. 10 258.56 low, and based on a parallel line measurement,
takes the SOX down to about the 240 level where the next oversold bounce might
come from. Remember, in bear markets you are shorting retracements to declining
longer-term moving averages and playing oversold levels where volatility is very
extended. With me, it is all about the move and lowest-common-denominator entry.
We’ll take it any way we can get it.
Have a good trading day.

Five-minute chart of
Friday’s SPX with 8-, 20-,
60- and 260-period
EMAs

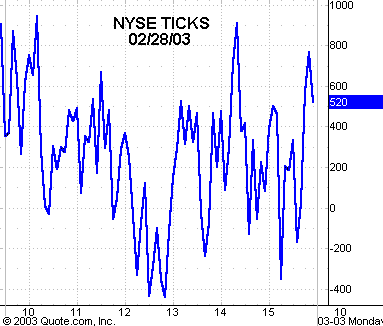
Five-minute chart of
Friday’s NYSE TICKS
