Riding the VIX
The VIX, the CBOE Volatility Index, also known as the fear indicator, uses the implied volatility of S&P 500 index options and is an index of the market’s forward looking view of volatility for the next 30 days.
This indicator is widely viewed as a way to measure market risk and forecast future movements. Some observers say that when the VIX is low, market risk is low and prices are likely to trend higher. This camp also says that when the VIX is high, lower prices are ahead as fear is the dominating force in the market.
Contrarians say to “sell the greed, buy the fear” and so when the VIX is low, contrarians would be anticipating declines in prices ahead and selling long positions or going short. When the VIX is high, they would be expecting a reversion to the mean and entering long positions.
If you’re interested in trading the VIX, iPath offers an ETN that tracks this index.
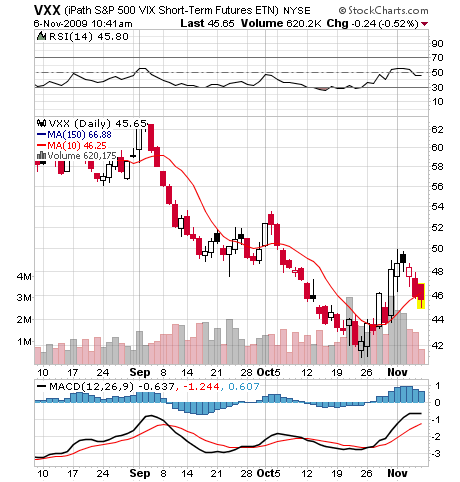
Chart courtesy of www.stockcharts.com
Its symbol is VXX and this issue can be traded like any other ETN or ETF using whatever technical indicators you prefer.
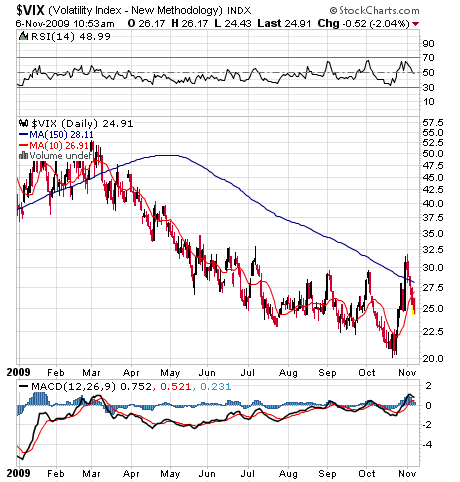
Chart courtesy of stockcharts.com
And above is a chart of the VIX, itself, with a 10 day/150-day Simple Moving Average superimposed over it. As you can see, the short term crossover picked up the rally soon after it started in March and near the end of November it’s inching back up and perhaps about to indicate a higher VIX ahead.
In my view, the best use of the VIX is to view it as not being “high” or “low” but rather what its trend is. A lower trending VIX seems to indicate higher prices over time as fear subsides while a higher trending VIX indicates rising fear and perhaps lower prices ahead. In any case, like with any technical indicator, the VIX should be used in concert with other indicators to confirm a suspected trend or change in direction.
Disclaimer: All material herein is believed to be correct but its accuracy is not guaranteed. This article represents solely the opinions of John Nyaradi and readers are encouraged to consult their investment advisors prior to making any investment decisions. All information herein is for general informational and educational purposes only. The information is of an impersonal nature and should not be construed as individualized advice or investment recommendations. There is risk of loss in all trading and readers are encouraged to read the full at https://www.wallstreetsectorselector.com/disclosure.html. None of the information in this article is intended to be investment advice or any kind or offer or solicitation to buy, sell or otherwise invest in any fund, company or security. Nothing herein represents a recommendation, claim, promise, guarantee or warranty regarding the suitability or profitability of any investment.
John Nyaradi is Publisher of Wall Street Sector Selector, an online newsletter specializing in sector rotation trading using Exchange Traded Funds.