Risk Reward Remains Negative for Longer Term Equity Exposure
***3/16/16: Due to a technical issue, a previous post was published by mistake. The correct text is now available below.***
The SPX remains in a bear market condition with the 20DEMA,<50DEMA <200DEMA [BTL]which was triggered by the long term RST sell signal following the 2135 5/15 high, and the monthly close below the May low of 2067 in June 2016 [see previous two commentaries] The risk reward remains poor for longer term equity players, and it is better to have a significantly reduced equity portfolio.
Leave the game to the shorter term traders, macro manipulators, and the algo gangs so you have plenty of equity ammo to use after a defined bear market correction which in my opinion is a minimum of least a .382 fib retracement to 667 from 2135, or -26.2% to 1574.
However, the highest probability is a a .50RT to 1401 [-34.3%] or .618RT [-42.5%] to the 1228 level, and then the game swings in your favor to increase exposure in a significantly O/S market. The SPX had declined -15.1% from 2135 to 1812 on 1/20/16 and was obviously significantly O/S with a positive daily chart 5 RSI divergence. It advanced to 1947, declined to a double bottom, yet lower low at 1810 [-15.2%] and has advanced +8.4% to 1963 last week and now sitting around 1942 as I complete this commentary.
The SPX monthly chart is also in a BTL [below the line] condition with the 3 month EMA below the 12 month EMA and both of them are declining. The bounce followed the O/S condition and positive 5RSI divergence after the 1812 and 1810 bottoms. The initial overhead resistance of note on the daily chart is the 377DEMA-200DEMA zone from 1987-2000.
There is some pertinent Pi symmetry as pointed out by Martin Armstrong regarding the possible collapse of the EU as we know it, Without a one currency and one debt system for all there is no way the EU or Euro will last. Socialism is collapsing all over the world yet our not so bright President has endorsed it-go figure. In Europe it is a race by clueless power hungry politicians to tax everything and anyone in order to remain in power and that`s what`s going on in the US.
The EU was started in Jan 1973 and there is a long term 43 year [5×8.6] Pi symmetry date this March. The UK is making noise about leaving the EU with a vote pending , so that would be a major catalyst for ‘the end”. Also, the Euro was started on 1/1/99 which is 17.2 years [2×8.6] to mid March so the symmetry is significant for both the EU and the Euro-stay tuned all you socialist fans of Bernie Sanders.
The US is doing the same thing as Govt continues to expand and crowd out the private sector. They call for more taxes yet the higher the tax the lower the GDP and the net result is always higher unemployment when less investment means lower job growth. They fudge the published GDP and employment numbers but they can run yet not hide and reality wins the race in the real world.
Yes, you can still day trade the current non correlated market with a high probability of success by using volatility and the pattern strategies to identify the opportunities. In the last commentary I said I would show you a quick manual method to calculate the Volatility Bands that many of you had subscribed to for so long and it as follows:
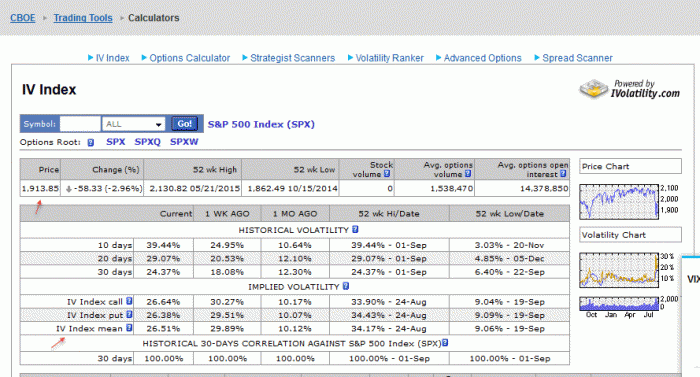
In the previous commentary I gave you the click sequence from www.cboe.com to get the data and I have included a snapshot of that chart data below. The factor to calculate the Volatility Bands and convert the 30 day average implied volatility [AIV] to the one day standard deviation levels [volatility bands] is 0.0523421.
Using the data on the included chart you see that the Closing PX was 1913.85 and the Implied Volatility Mean was 26.51 but you move the decimal point to read .2651 Now to get the 1.0 VB you multiply .2651 x 1913.85 =507.36 x 0.0523421 [factor] and you get the 1.0 VB which is 26.55 points. To get the +1.0 VB you add 26.55 points to 1913.85 which is 1940.4 and subtract 26.55 from 1913.85 to get the -1.0 VB which is 1887.3.
In order to calculate the the 1.28, 1.5, 2.0, and -3.0 VB`s, you multiply 1.28 x 26.55 = 33.98, 1.5 x 26.55=39.82, 2.0 x 26.55 =53.10, and 3.0 x 26.55 =79.65 You get the cash prices of the VB`s by adding and subtracting the VB`s in points to and from the closing price of 1913.85.

VB in points: 1.0 26.55, 1.28 33.98, 1.5 53.10, 2.0 53.10, 3.0 79.65
Probability of the VB [STDV Levels] are: 1.0 68% 1.28 80%, 1.5 88%, 2.0 95%, 3.0 99%
If you have any questions email me at haggs91@yahoo.com,
Kevin Haggerty
