Sell the Resistance Zone
From 1990 to 1997, Kevin Haggerty served as Senior Vice President for Equity Trading at Fidelity Capital Markets, Boston, a division of Fidelity Investments. He was responsible for all U.S. institutional Listed, OTC and Option trading in addition to all major Exchange Floor Executions. For a free trial to Kevin’s Daily Trading Report, please click here.
Commentary for 9/15/11
After the previous commentary for 9/6/11 [Market Fails at Resistance] the SPX finished the 4 day Holiday shortened week at -1.7% to 1154.23 The SPX went -0.7%, +2.9%, -1.1%, and -2.7% It was a very volatile week driven by the European sovereign debt news for Greece, Italy, and all the PIIGS which is not going away anytime soon.
Also, the economic outlook for the US remains dismal as many useless Economists are tripping over themselves to lower their GDP estimates for 2011 and 2012. They haven`t been right on a damn thing on the way up, so lets hope they are wrong again on the downside. What a game, and they actually get paid. The economic anchor on CNBC [Steve Liesman] hypes almost every economic report as positive, and sounds like a shill for the Obama Administration.
It is a “shoot first ask questions later” market on any perceived negative news” regarding the Euro sovereign debt crisis, and US ecomomic forecasts continue to get lowered after the fact, as do the S&P 500 earnings estimates for 2011, so it makes sense to sell the strength in the resistance outlined below.
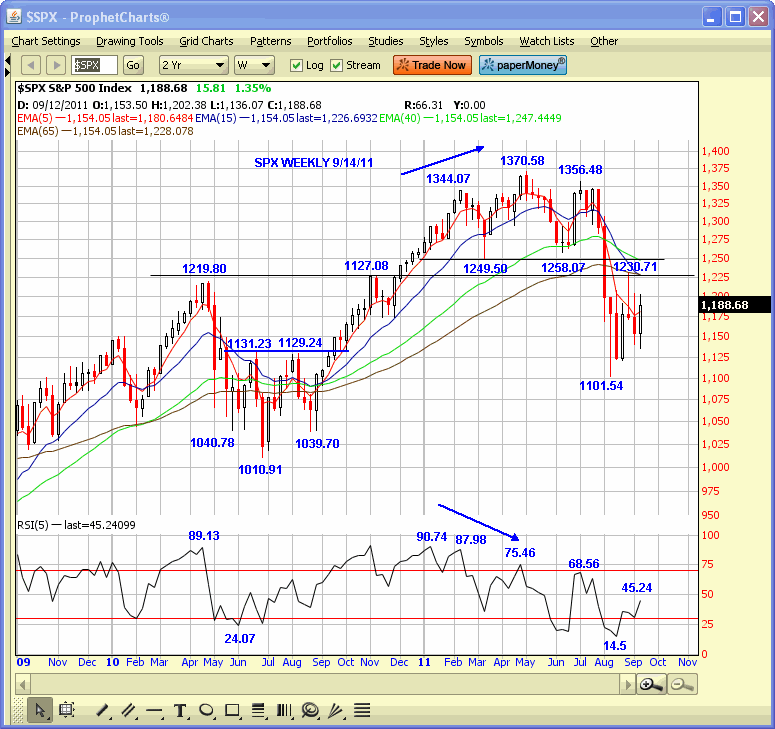
The SPX made an intraday high at 1230.71 on 8/31/11 versus the 1228.75 .618RT to 1576 from 667, and also the 1227.08 high on 11/5/10 It closed that day at 1218.89 That was a +11.7% rally from the 1101.54 low, before it declined -7.7% to 1136.07 this past Mon [9/12], and as I complete this commentary it is trading at 1197 [9:51AM]
The 1219.80 and 1227.08 highs are in play again as is the 1228.75 .618RT. Also, the 65WK EMA is 1228.29, so that is excellent symmetry with the .618RT, and also the 15WK EMA at 1228, so there is a resistance cluster in that zone. The next resistance zone is the 1249.50 and 1258.07 zone with the 40WK EMA at 1248.
All of the longer term EMA`s are declining, and there is significant overhead resistance, so sell the strength into that zone or reduce equity allocations.

Click here to find full details on Kevin’s courses including Trading with the Generals with over 20 hours of professional market strategies. And for a free trial to Kevin’s daily trading service, click here.
