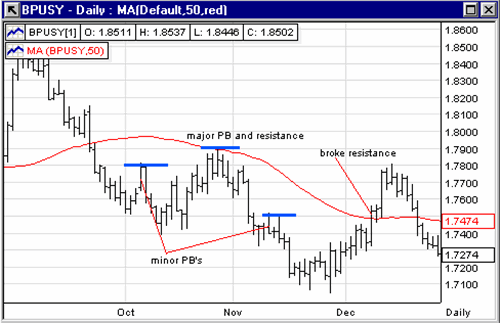
Sharp pullback to 50-day MA in downtrend
Pullbacks continue to be one of the most consistent and
profitable trading patterns that exist. Equities, futures, commodities and
forex are all filled with charts of pullbacks, both to the long and the short
side.
This example takes a look at how we can use trading pullbacks
to short the Forex market. Specifically, let’s use the 50-day simple moving average
(SMA) to
see if we can find some instances of extreme overbought conditions to time reversals and get the
best price for your buy-in. The first thing to do when looking for pullback
opportunities is to identify the trend. This is most easily done using
moving averages,
which give you a good idea of how the prior price performance. For our purposes we will use only the 50-day
SMA.
Here
we are looking to short pullbacks, so we are scanning for setups underneath
their 50-day SMA. The pullback occurs when the down trending price makes a
move up towards the SMA, only to resume the downtrend later. Simply
understood, the pullback to the 50-day SMA stretches the price far enough from
the dominant downtrend that it produces an extreme overbought condition. The
potential for price action to snap-back into the downtrend gives traders an
opportunity to enter as the down move resumes. The 50-day SMA is a great
indicator to use, because of the extent to which price has to stretch in order
for it to be reached. By knowing where the
50-day SMA is in relation to the price, traders can get a better buy-in price
when shorting pullbacks.
The GBPUSD was in a solid downtrend during the month of
October, 2005. In October, the currency attempted 1 major and 2 minor
pullbacks to the moving average, all of which failed and resulted in a
continuation move down. Notice on the chart that the 50-day moving average
seems to exert pressure on price as it gets nearer, resulting in a more powerful and
longer-lasting move down. The closer to the average price gets, the
stronger the reaction is. Also notice in December that price was able to
break through the SMA, and then staged a short rally.

Let’s look at ADUSD for another example. The Australian
Dollar was declining against the U.S. Dollar through October, establishing a
downtrend beneath the 50-day SMA. Price attempted a pullback to the SMA at
the beginning of the month and the end of the month, and the stock continued to
fall until bottoming out in the middle of November. On December 2nd price
broke through the 50-day, resulting in an even more extreme overbought level.

Use pullbacks to get a
better entry price in a trending stock. By using the 50-day simple moving
averages, traders can gain an edge in timing price reversals and continuations,
using the SMA as a major point of support/resistance.
John Patrick Lee
Associate Editor
