Short-Term Decline No Surprise
What Monday’s Action Tells
You
The SPX
(
$SPX.X |
Quote |
Chart |
News |
PowerRating) had declined from
1215.74
to 1211.65 on Friday from 3:40 p.m. ET to 4:00 p.m. as sell programs hit the
NYSE floor into year-end. Yesterday the SPX recovered that program decline,
trading to a 1217.90 intraday high on the 9:35 a.m. bar and then was trend
down
to an intraday low of 1200.36 and a 1202.08 close, -0.8% on the day. The
(
SPY |
Quote |
Chart |
News |
PowerRating) was 120.30, -0.5%, making a small gain off the lows from 4:00
p.m. –
4:15 p.m. The Dow
(
$INDU |
Quote |
Chart |
News |
PowerRating) was -0.5% to 10,729, while both the Nasdaq
(
$COMPQ |
Quote |
Chart |
News |
PowerRating) and
(
QQQQ |
Quote |
Chart |
News |
PowerRating), 39.50, were off about 1.0%.
NYSE volume was 1.5 billion shares, with a
volume
ratio of 22 and breadth -1516. The SPX remains in its rising wedge and just
above its 20-day EMA of 1200.66 with the SPY at 120.30 and the 20-day EMA at
120.10.
Many of the strongest momentum-phase holdings
of
the Generals were the biggest decliners yesterday, in addition to the energy
sector, which was the leading sector in 2004. The
(
OIH |
Quote |
Chart |
News |
PowerRating) was -3.4%,
closing
at 82.17 and below its 50-day EMA at 82.68, which becomes the immediate
upside
focus, while the 80.50 – 80.75 zone is the first downside retracement level
of
interest for this corner.
The
(
SMH |
Quote |
Chart |
News |
PowerRating) lost 2.0% after a re-cross back
below its 200-day EMA of 33.64 following the 33.77 intraday high. There was
also
an Opening Reversal/Trap Door for those of you with my material.
The Dow was led by
(
WMT |
Quote |
Chart |
News |
PowerRating), +1.0%, and
(
HD |
Quote |
Chart |
News |
PowerRating),
+0.8%, with a non-Dow stock,
(
LOW |
Quote |
Chart |
News |
PowerRating), also +0.6%, so there was a common
thread
there, as there was with some of the brokers like
(
GS |
Quote |
Chart |
News |
PowerRating), +0.9%, and
(
MWD |
Quote |
Chart |
News |
PowerRating),
+0.7%, as the analysts hype potential investment banking profits in 2005.
And
the beat goes on.
For Active
Traders
The SPX gap up opening set up both a
Trap
Door and
RST sell entry below 121.61 on the SPY and 1219.25 if you traded the
ESH5.
The SPY traded down to 120.49, then gave you an RST buy entry above 120.63
which
only ran to 120.90 before reversing down to a 119.90 low and 120.30 close.
There
was also a
1,2,3Â Higher Bottom entry above 120.63.
Today’s
Action
The SPY closed on an outside bar, engulfing
the
previous seven days and closing below those seven lows. The 120.10 20-day
EMA is
the immediate focus trading line for daytraders today. If you’ve read my
commentary the last 10 days, you had the SPY rising wedge daily chart with
negative oscillator divergences, so there should be no surprise at any
short-term decline following any new January money put to work by the
Generals.
Also, there is a time zone in mid-January, so that will depend on whether
the
SPX is advancing or declining into that time period.
The
(
DIA |
Quote |
Chart |
News |
PowerRating) closed at 107.32 with the
immediate
20-day EMA focus line at 106.92 and minor support about 106.50. The SOX
closed
at 424.35 and once again below the 426.65 40-week EMA. It remains at a key
level
this week and is why I made it a key two-way focus, both long and short, for
early 2005.
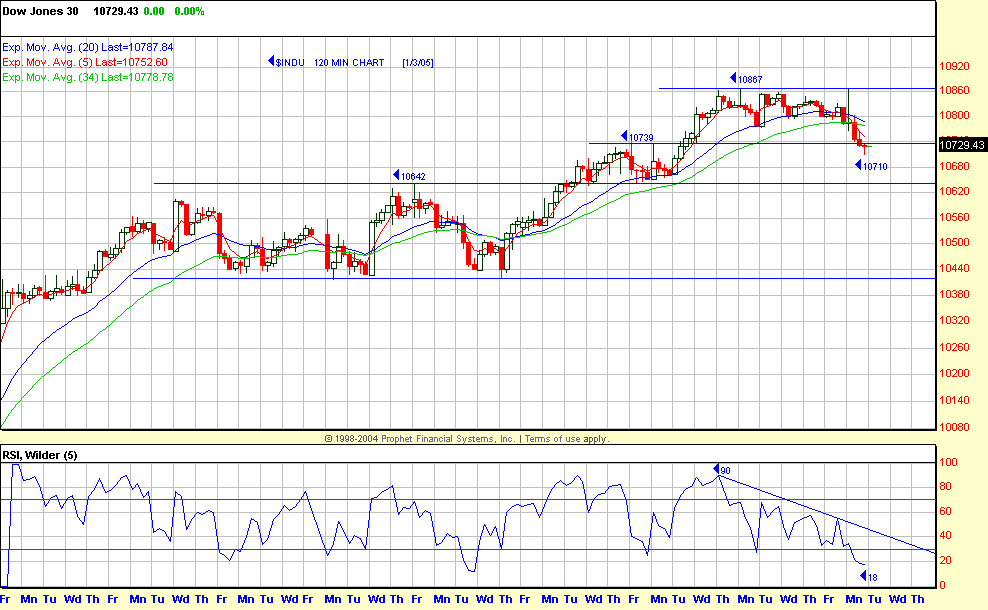
The Dow closed at 10,729 and gets some space
trading above 10,739 (see 120-minute chart), then has the 34 EMA at 10,779,
so
the “523” trend method is down until those lines are surpassed.
The next minor
support level is 10,640 – 10,650.
Have a good trading day,
Kevin Haggerty
Â

