Short Term, Here’s The Drill
Yesterday was a reflex rally for the major indices from a short-term oversold
condition. NYSE volume
expanded to 1.69 billion, a volume ratio of 66, and breadth +786, all good
numbers. Tech led the rally, as the Nasdaq
(
$COMPQ |
Quote |
Chart |
News |
PowerRating) finished +2.1% and
the NDX 100
(
$NDX.X |
Quote |
Chart |
News |
PowerRating) +2.6%. You saw both of these indices outperform the
previous two days, along with the
(
SMH |
Quote |
Chart |
News |
PowerRating)s, which I had pointed out with the
increase in volume, narrowing range, and price not giving ground. These are
dynamics that usually precede a change in direction from the previous short-term
move.
The SMHs were the leaders
yesterday at +3.2%. As a trader going into yesterday, your focus should
definitely have been on the
(
QQQ |
Quote |
Chart |
News |
PowerRating)s and SMHs, assuming the major indices
rallied. You go through this procedure on a daily basis using my S&P 500 and NDX
100 screens (see the bottom of this page) in order to identify buying or selling
pressure. That will alert you to potential changes in direction.
The SPX
(
$SPX.X |
Quote |
Chart |
News |
PowerRating)
at +1.0% yesterday and the Dow
(
$INDU |
Quote |
Chart |
News |
PowerRating) +0.6% both lagged the tech-heavy
indices. Both of these indices rallied yesterday off of their 2.0 three-month
standard deviation bands.
It was a good trading day
for daytraders across the board. The QQQs after the gap up opening reversed and
sold down to the 260 EMA on your five-minute chart and gave you a signal bar and
entry, and then traded up for the rest of the day on higher highs and lows. The
SMHs did the same, except that they only pulled back to the 60 EMA, which in
fact is the same as the 20 EMA on a 15-minute chart. They then gave you entry
and trended up into the close. If you have the most recent
module on first-hour trading, you recognize that trade as a Gap Pullback
trade, which was net neutral on entry which is no problem, as there was
confirmation with the EMAs.
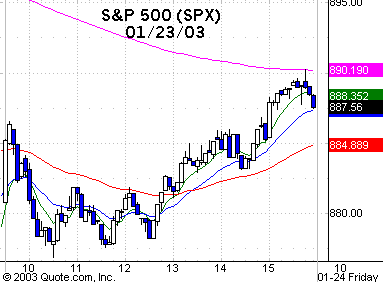
The SPYs and futures gave
you a different look and the entry pattern was a 1,2,3 lower bottom and also an
RST. The 1,2,3 entry was reversing the 877.72 low and the RST was about the
same, with entry above the signal bar high of 878. The SPX ran to an intraday
high of 890.25. Not a bad intraday move off the 2.0 standard deviation band as
we all got lucky as the gap up opening reversed down, which gave us all these
high risk/reward entries.
This oversold reflex runs
into some immediate moving average resistance just above. The QQQs have four
EMAs from 25.50 to 25.86. The SMHs closed at 23.18 and have their EMAs from
23.50 to 24.94. The SPY closed at 88.70 and has moving average resistance from
90.21 to 90.83. The
(
DIA |
Quote |
Chart |
News |
PowerRating)s closed at 83.44 and run into overhead resistance
from 85.33 to 85.89. The EMAs I refer to are the 8, 20, 50 and 89. The 200 EMAs
are at higher levels for all of these proxies.
Breaking of the Dec. 31
lows is necessary in my mind to set up the reversal pattern I have an interest
in for the next good trading move. For the QQQs, that zone is 23.20 – 21.69. For
the SPX, the strongest confluence is 852 – 840. If this current reflex carries a
few days, I expect another downturn to start in the first few days of February,
if not before. Barring an unusual move by Saddam to take a permanent vacation, I
expect the Dec. 31 lows to get taken out. In the meantime, take any intraday
continuation long trades during this reflex until the proxies run into the
immediate overhead resistance that I mentioned previously.
Have a good trading day.

Five-minute chart of
Thursday’s SPX with 8-, 20-,
60- and 260-period
EMAs

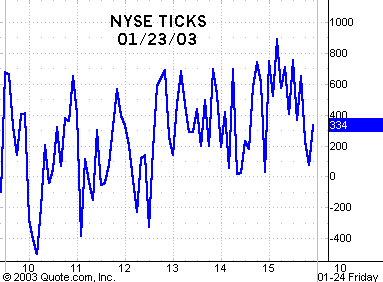
Five-minute chart of
Thursday’s NYSE TICKS
