Short Term Trading Strategies and the VIX: Bottom or Bounce?
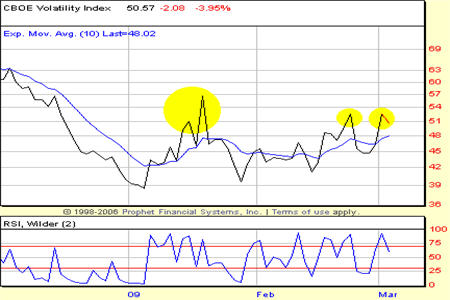
For the third time this year, the VIX or CBOE Volatility Index stretched more than 5% above its 10-day moving average. What does this mean for short term traders?
Writing in their most recent book, Short Term Trading Strategies That Work, Larry Connors and Cesar Alvarez note that the VIX can be a powerful tool for short term traders, but only when used correctly.
Since 1995, Larry Connors has been analyzing and writing about the VIX. But his most important discovery about this indicator did not come initially. As he writes:
“Within a year after looking at the VIX as I was originally doing, I realized that the VIX is a dynamic indicator. In fact, most if not all volatility indicators are dynamic indicators. What does this mean? It means that volatility is always adjusting. And if volatility is always adjusting, so should your volatility indicators.”
How do short term traders incorporate this insight? Larry and Cesar have developed a number of short term trading strategies using the VIX that can help traders know when the markets are likely to outperform and when they are likely to underperform. A large part of trading lies in knowing when the edges are on your side. Knowing when the markets have a bias to the long side or the short side – through an analysis of the VIX – can be a major part of that edge.
Today I want to focus on an aspect of what Larry and Cesar call the VIX Stretches Strategy. To learn about the complete strategy, read Chapter 12 of Short Term Trading Strategies That Work (What?! You don’t have a copy?! Take care of that right now by clicking here). For now, I want to highlight one aspect of the strategy that might be relevant to our current market.

Based on his understanding that volatility indicators must be dynamic, Larry discovered that the best way to analyze the VIX is to compare it to its own recent behavior. Specifically, he found that when the S&P 500 is trading above its 200-day moving average and the VIX is stretched 5% or more above its 10-day moving average and remains that way, stocks have a tendency to outperform.
How does this relate to our current market – with an S&P 500 that is decidedly below its 200-day moving average but a VIX that is increasingly stretched above its 10-day moving average?
I see the current action in the VIX as a warning against becoming too bearish, rather than as an “all clear” buying signal. The VIX is showing that even with the S&P 500 plunged far below its 200-day moving average, the level of fear is high and growing. While this will not prevent traders and investors from becoming even more fearful – sending stocks even lower – it does warn short term traders that the edge for selling short – namely, high prices, overbought conditions and greed – are not in place. And as tempting as it may be to join in on the sleigh-ride to Dow 5,000 or wherever the market seems to be headed these days, the savvy, professional trading strategy – according to the VIX – suggests remaining patient while the trading and investing hordes panic.
For more information on VIX trading strategies, there is no better source the Short Term Trading Strategies That Work by Larry Connors and Cesar Alvarez. Click here to find out how to get your copy!
David Penn is Editor in Chief at TradingMarkets.com.
