Show Me
There’s
not much Friday marketÂ
to talk about so I will keep this very brief. Both the Nasdaq 100
(
NDX |
Quote |
Chart |
News |
PowerRating) and S&P 500
(
SPX |
Quote |
Chart |
News |
PowerRating) have moved down into the middle of their
ranges. We have just completed a seven-day run since May 30 on the SPX from 1248
to 1287 back to the 1265 close on Friday.Â
The NDX ran from 1779 to
1967, closing Friday at 1896 which is just above equilibrium of the 1982 to 1743
range. I would be surprised if
there was any real oomph to upside moves this week, just maybe a quick news
rally or two. The ease of movement in my opinion is to the downside, in the
absence of any unknown news.Â
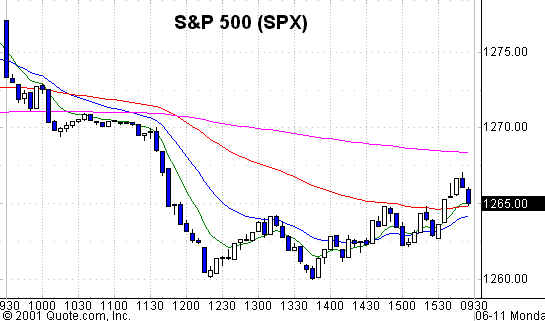
The SPX has a 1260 double
floor from Friday’s 5-minute charts and closed at 1264.96. The 100-day EMA is
1263.15, the 50-day is 1254.11 and the pivotal low is 1245.96. Nothing upside
happens for position traders unless the SPX can get out of the range above 1273,
then hold it, and get past the 1286.62 last swingpoint high.
A continuation above the
1300 200-day EMA and then the 1316 rally high will bring significantly more
money into the market. I have given you the “show me” numbers and
anything inside those lines is just subjective debate regarding overall market
gibberish, but individual stocks are always an exception.
Daytraders depend on riding
the momentum of strong and weak market days — as opposed to just individual
stocks — so we would like to see the trading ranges resolved up or down, not
sit at equilibrium. I have included a daily chart of the SPX which highlights
the 1,2,3 bottom move, giving trend entry after the 1081 low which was within 2%
of the exact .786 retracement of the longer-term low, and the current potential
1,2,3 which can lead to a Fib retracement of the 1081 low.
I have indicated these
levels on the chart below for your reference.
Â

Daily chart of S&P 500
(
SPX |
Quote |
Chart |
News |
PowerRating) with 20-day,
50-day, and 200-day
EMAs
Â
Stocks
Today
|
(September
|
||
|
Fair Value
|
Buy
|
Sell
|
|
10.85
|
 12.05  |
 9.50 Â
|
Computer action on Friday
is no reason to operate from the daily charts today, so we are going to pass on
any stocks because the action doesn’t dictate what kind of buying and selling
pressure there was, so we’ll let the Generals show us the way today.
Have a good trading day.

Friday’s SPX chart with 8-period,
20-period, 60-period
and 260-period
EMAs

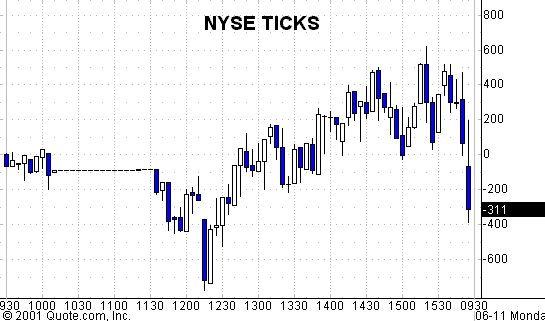
Friday’s NYSE
TICK chart
Do you have a follow-up question about something in this column or other questions about trading stocks, futures, options or funds? Let our expert contributors provide answers in the TradingMarkets Trading Advisor! E-mail your question to questions@tradingmarkets.com.
For the latest answers to subscriber questions, check out the Q&A section, linked at the bottom-right section of the TradingMarkets.com home page.
