Some Change In Character?
As
we commented last week, there were a number of deeply oversold indicators that
would give us reason to suspect that at least a bear market rally could erupt at
any time. The Dow has rallied off
of a Fibonacci support zone in a Fibonacci time frame, something that rarely
fails to occur at key intermediate-term lows and highs, providing more evidence
that a decent rally may be in the making here. Notice that breadth indicators are improving markedly on this rally, but
none of our key breadth indicators to watch has yet flashed a buy signal. So for now let’s monitor this rally carefully to see if it develops into
something that is tradable via our strategy.
Â

Leading
markets are starting to show some real progress. Lumber has exploded out of a sloppy-but-clear base
to the upside and is
showing some runaway characteristics. Bonds
broke a long uptrend line and are within 3/4 of a point of breaking down out of
a double top (watch 101-20 level for a breakdown on nearby futures). Copper is rallying off of a potentially significant support level,
although it is far from making or breaking out of a significant basing pattern. These forward-looking markets are not yet all in clear agreement that the
economy has bottomed, as we would like to see. But they look substantially better than they have for many
months and
bear close watching next week for more positive action.
Â


Continue
to watch our breadth indicators carefully for signs of a REAL rally developing. Look for two or more of the following breadth tools to indicate a
possible strong leg up before getting too excited about buying stocks again:Â 1) the five-day
MA of up volume being greater than 77% of the five-day MA of total volume on a day after the low has been made;Â 2) the
11-day MA of advances are >1.9 times the 11-day MA of
declines;Â 3) up volume/(up volume +
down volume) is >90% on a given day;Â 4)
the S&P rises by 2.75% or more on a given day and 70% of issues traded
advance on the NYSE;Â 5) After the
fifth day following a market low price, we get a strong follow-through day, a day
where two or more of the major averages are up more than 1% on volume that is up
from the prior day and at least 20% above the 50-day MA of volume;Â 6) finally, and most importantly, that we get a large number of breakouts
to new 52-week highs by stocks that are strong EPS and strong RS leaders
breaking out of bases that are four-plus-week solid bases on strong volume. Investors are advised to wait for at least two of the above breadth
criteria to develop before beginning to increase equity allocations.
Let’s
look at some numbers from the week. New
Highs vs. New Lows on our RS/EPS lists were 18/14, 8/16, 15/15, 28/6, and 24/6
— quite a turnaround from last week, as new highs
gained dominance while new lows plummeted. No trend is yet crystal clear, but an internal shift toward the bull side
may be developing here. There were
roughly 13 breakouts on the upside to new highs of stocks on our Top RS/EPS New
Highs lists, with only four breakdowns
on the downside of four-week-plus consolidations on our Bottom RS/EPS New Lows
lists. More significantly,
there were four close-calls on the upside this week with only one close call on the
downside — stocks almost meeting our criteria that broke out of sound bases (ENI
S.P.A.
(
E |
Quote |
Chart |
News |
PowerRating), Christopher & Banks
(
CHBS |
Quote |
Chart |
News |
PowerRating), HCC Insurance
(
HCC |
Quote |
Chart |
News |
PowerRating), and
MDC Holdings
(
MDC |
Quote |
Chart |
News |
PowerRating) on the upside with only Global Crossing
(
GX |
Quote |
Chart |
News |
PowerRating) on the downside). Of course, a
truly good environment would show five or more times this number of breakouts with
dozens of close calls, or stocks actually meeting our criteria breaking out. But there has been some of the sharpest improvement we’ve seen for some
time this week. Nonetheless,
opportunities remain fairly sparse, so we’ll continue to remain mostly on the
sidelines until stocks meeting all of our criteria appear en masse. Our one lone short dropped substantially and nicely this week.
Our
overall allocation is still VERY DEFENSIVE with 92% in T-bills awaiting new
opportunities, and 8% in short-sales. Our
model portfolio followed up weekly in this column ended 2000 with about an 82%
gain on a 12% maximum drawdown, following a gain of around 41% the prior
year. For year 2001, we are now down
about 2.5%, with a mostly cash position.  Â
For
those not familiar with our long/short strategies, we suggest you review my
10-week trading course on TradingMarkets.com, as well as in my book The
Hedge Fund Edge and course “The
Science of Trading.” Basically,
we have rigorous criteria for potential long stocks that we call “up-fuel,”
as well as rigorous criteria for potential short stocks that we call “down-fuel.”
Each day we review the list of new highs on our “Top RS and EPS New
High list” published on TradingMarkets.com for breakouts of four-week or
longer flags, or of valid cup-and-handles of more than four weeks.
Buy trades are taken only on valid breakouts of stocks that also meet our
up-fuel criteria. Shorts are similarly
taken only in stocks meeting our down-fuel criteria that have valid breakdowns
of four-plus-week flags or cup-and-handles on the downside.
We continue to buy new signals and sell short new short signals until our
portfolio is 100% long and 100% short (less aggressive investors stop at 50%
long and 50% short). In early March of
2000 we
took half profits on nearly all positions and lightened up considerably as a
sea-change in the new economy/old economy theme appeared to be upon us. We’ve been effectively defensive ever since, and are now as
defensive as possible.
Upside
breakouts meeting up-fuel criteria (and still open positions) so far this year
are: none; and last week we had no valid
pattern breakouts up in stocks meeting our up-fuel criteria (see 10-week trading
course). Continue to watch our NH list
and buy flags or cup-and-handle breakouts in NH’s meeting our up-fuel criteria —
but continue to add just two per week.
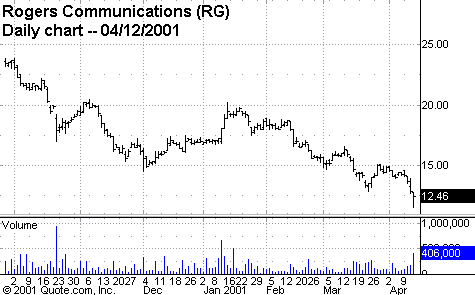
On
the downside, this year we’ve had breakdowns from flags (one can use a down
cup-and-handle here as well) in stocks meeting our down-fuel criteria (and still
open positions) in: Rogers Communications
(
RG |
Quote |
Chart |
News |
PowerRating)
@14.32 (12.88) w/15 ops. Continue to watch
our NL list daily and to short any stock meeting our down-fuel criteria (see 10-week trading course) breaking down out of a downward flag or down
cup-and-handle. Here, too, remain
cautious by only adding two shorts in a week, until we get more consistency
in the number of downside breakouts in a given week off of our Bottom RS/EPS New
Lows lists.
Our
strategy remains simple and relatively cautious as well:Â
protect against whip-saws by waiting patiently for real low-risk highly
reliable trades that meet ALL of our criteria.Â
Remember our goal to make consistently better than market returns (20%+
average annually) with relatively less drawdown risk than the market. Â
Smile and think of the carnage we’ve just avoided from the sidelines.Â
When valid breakouts of up-fuel or down-fuel stocks become abundant again,
we’ll pounce with both hands. Until
then, we must tread cautiously to avoid getting chewed up.Â
If a real bottom develops, don’t worry about missing it – when a clear
uptrend begins we’ll catch up to the gains since the bottom by being in the
leading stocks.
strategy remains simple and relatively cautious as well:
protect against whipsaws by waiting patiently for real low-risk highly
reliable trades that meet ALL of our criteria. Remember,
our goal to make consistently better-than-market returns (20%+ average annually)
with relatively less drawdown risk than the market.
Smile and think of the carnage we’ve just avoided from the sidelines.
When valid breakouts of up-fuel or down-fuel stocks become abundant
again, we’ll pounce with both hands. Until
then, we must tread cautiously to avoid getting chewed up.
If a real bottom develops, don’t worry about missing it — when a clear
uptrend begins, we’ll catch up to the gains since the bottom by being in the
leading stocks.
Gary
Kaltbaum on TradingMarketsWorld ! Gary Kaltbaum will be appearing on the
Intermediate-Term Trading board Thursday, April 19 at 8:00 ET. Be sure to take
this opportunity to chat with and have your questions answered by a leading
intermediate-term trader. Click
here to take your trading to a new dimension.