Some Interesting Trades Are Setting Up
Remember a couple of
weeks back when I wrote about how there are days when
it is challenging to find something to write about that will not only be
enjoyable to read, but also helpful? No, today is not one of those days, but
with the market quiet recently, there certainly were. As I mentioned in
Monday’s column, I am mainly taking part in HVT
during the opening only, and then looking for intermediate-term trades after
that. The trade in the SMHs is an example
of that.
However, I see some interesting trades setting up
on the horizon. And what better place to search for these than in “fairy tale
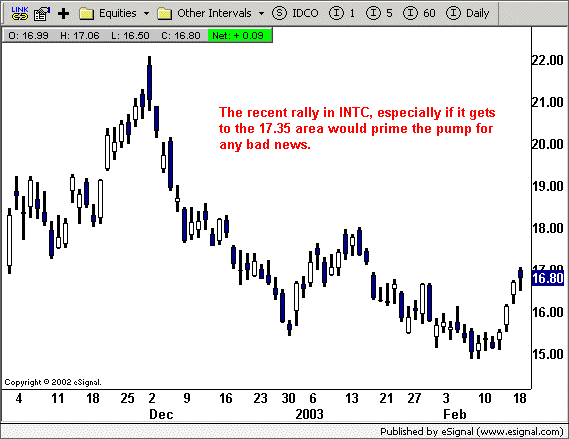
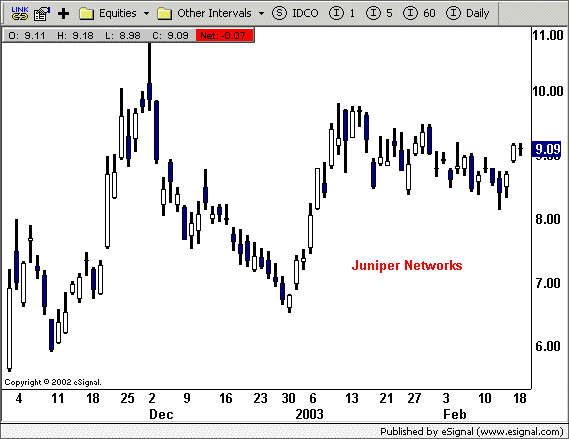
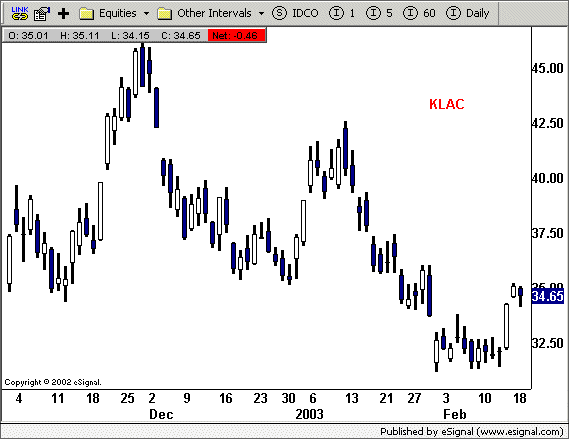
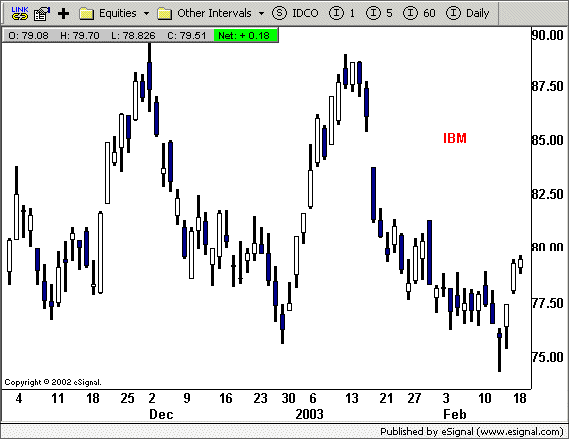
land,” i.e., tech stocks. They have had a nice run in the last few sessions, and
with mid-quarter “previews” due in the next couple of weeks, they are
particularly vulnerable. Witness the layoffs at
(
MU |
Quote |
Chart |
News |
PowerRating) and
(
AMAT |
Quote |
Chart |
News |
PowerRating), certainly not a sign of
strength, however, some rocket scientist figured that if the chip equipment
makers were laying off, that would mean that Intel is not only selling more
chips, but also looking to make more (??). Or maybe because of its “value.”
Either way, a rally in the next few sessions will put the following stocks in a
nice position for shorts, if, as I expect, the companies continue to “spin” or
come right out and say business stinks.
You may recall that there was a similar setup
back in mid-January. You had many an analyst (if you can call them that)
recommending chip stocks, not only after the meteoric rise from the Jan 2, but
also right into a Fibonacci time cycle (Jan. 14-16) which nailed the turning
point to the day. Boy, I wish I could get paid $2 million a year to blow up
clients!
Well, it may just be deja vu all over
again. The tables are being pounded, valuations are insane (although the chap
who upgraded
(
INTC |
Quote |
Chart |
News |
PowerRating) cited good valuations), business stinks, but more
importantly, the charts are beginning to set up. So let’s take a look, and
decide on a game plan. Mid-quarter updates are due out in a couple of weeks,
last week of February and first week in March. Based on what I read (not the
mainstream press) it is hard to imagine anything genuinely positive coming out
of these companies. The following information was derived from The High Tech
Strategist:
(
IBM |
Quote |
Chart |
News |
PowerRating):
- Underfunded pensions has left little
cash to buy back more shares. In fact only $75 million were purchased in Q4.
This will be dilutive going forward, a trick that IBM has been playing for
some time now in order to magically make that estimate or beat it by a penny.
the Price Waterhouse acquisition.
(
INTC |
Quote |
Chart |
News |
PowerRating) &
(
AMD |
Quote |
Chart |
News |
PowerRating):
- “There’s no doubt about it. There is
going to be some computer channel clearing in the first quarter. That’s bad
news for the computer component makers. Intel and AMD are both high on my
list of Q1 pre-announcement candidates (early March)”
— THTS
(
MOT |
Quote |
Chart |
News |
PowerRating) &
(
NOK |
Quote |
Chart |
News |
PowerRating):
- Excess inventory is everywhere. Both admitted
last month that there were excess inventories in the channel. - MOT reported 9.8 weeks of inventory at year
end, a 10% increase from last year
Again, these bullet points are not meant to be
the backdrop for trade recommendations, and certainly most traders do not pay
attention to fundamentals. However, they are the catalyst which can further
intensify a move lower, once the technical picture weakens. I use it more as a
back-drop for what may coincide with some great shorts setups on the technical
side in the days and weeks to come. Naturally, with a trading approach like
this, one may do better to consider using puts vs. selling the stock short
outright. Look at the charts below, all of these stocks have come up nicely off
their recent lows.


The timing of these mid-quarter updates falls
rather nicely right into another Fib time extension (March 9, give or take),
if (and that is a big if) the market continues higher up to that
point, there will be suddenly many pieces starting to come together for a trend
change. Naturally, bad news in tech would lead the market lower, Fib time cycles
would add fuel, and a potential war in Iraq point to a potentially nice trade(s).
Remember, a Fib time cycle
only predicts time, not direction. Typically the trend is reversed at these
periods. Witness Jan. 14-16, Feb. 14.
Going back to some HVT
material. The current market is still only offering a few setups each
morning. The rest of the day, for me at least, does not offer good risk/reward.
Keep the powder dry and focus on intermediate setups until Iraq comes to a head.
Regardless of the outcome or market direction, I suspect that we will have a
very nice pocket of volatility. You will need to be ready and step up to the
plate.
The following is an excerpt from my nightly trading service. It was written
by my colleague, Bo Harvey. I am putting it in today’s column because he
eloquently outlines the current state of the market on an intraday basis:
| “The past week or so has been somewhat choppy from an intraday swing trading standpoint. The S&P and Nasdaq futures are both stuck between some pretty critical levels, and right now there is little momentum to carry us decisively one way or the other. Whether this has to do with the uncertainty regarding the situation in Iraq or not does not really concern us, but what does matter is putting the probabilities in our favor. Quite simply, there are very few intraday swing setups appearing on our screens, and I suspect that it will take a break one way or the other before the setups begin appearing again. Patience is one of the most critical aspects of trading and must be exercised now. The levels we are closely watching are: 856 in the S&P, which, if
In the Nasdaq, 1019-1025 and 1039-1044 are both huge resistance levels
It is important that you continue to pay attention to the commentary on |
Â
| Support/Resistance Numbers for S&P and Nasdaq Futures |
|||||||||||||||||||||
|
* indicates a level that is more
significant
Don’t forget, my new book, “How
I’ve Achieved Triple-Digit Returns Daytrading…4 Hours A Day” is now
available. Order today and you will receive a 10% discount.
As always, feel free to send me your comments and
questions.
PS: Buy my book, and get a
FREE 2 Week Trial to my Daytrading Service.
Click here for more details.
