Squeeze Bias Is Long Today And Friday
It was another energy day with crude oil trading
to 51, +1.3 points (+2.6%). The spike came on the 10:30 a.m. ET bar on a report
about a decline in crude oil inventories that gave hedge funds the chance to run
them and probably some shorts scrambling to cover. There were some
Trap Door
entries prior to the spike in stocks like
(
SLB |
Quote |
Chart |
News |
PowerRating) and
(
COP |
Quote |
Chart |
News |
PowerRating) and also other
Opening Reversals on the 10:30 a.m. bar. Daytraders that play in the energy
stocks caught some windfall profits yesterday.
In the real world, the market action was soft and
down with the SPX
(
$SPX.X |
Quote |
Chart |
News |
PowerRating) -0.3% to 1190.01, the Dow
(
$INDU |
Quote |
Chart |
News |
PowerRating) -0.4%
to 10,458, the
(
QQQQ |
Quote |
Chart |
News |
PowerRating) -0.4% to 37.81 and the Nasdaq
(
$COMPQ |
Quote |
Chart |
News |
PowerRating) -0.6%
to 2050. NYSE volume was on the lower side at 1.3 billion shares with the volume
ratio negative at 34, as was breadth -1156 with the 4 MA turning slightly
negative to -158. The 4 MA of the volume ratio is down to 48 due to the last
five days of the
(
SPY |
Quote |
Chart |
News |
PowerRating) churning at the sequence zone from 119.33 – 120.11,
which includes the 119.54 .618 retracement to the 123.25 bull cycle high from
the 113.55 04/20/05 low. For example, the SPY highs for the past five days were
119.41, 119.39, 120.04, 119.83 and 119.87 yesterday. The SPY volume for the five
days is about -35% below average.
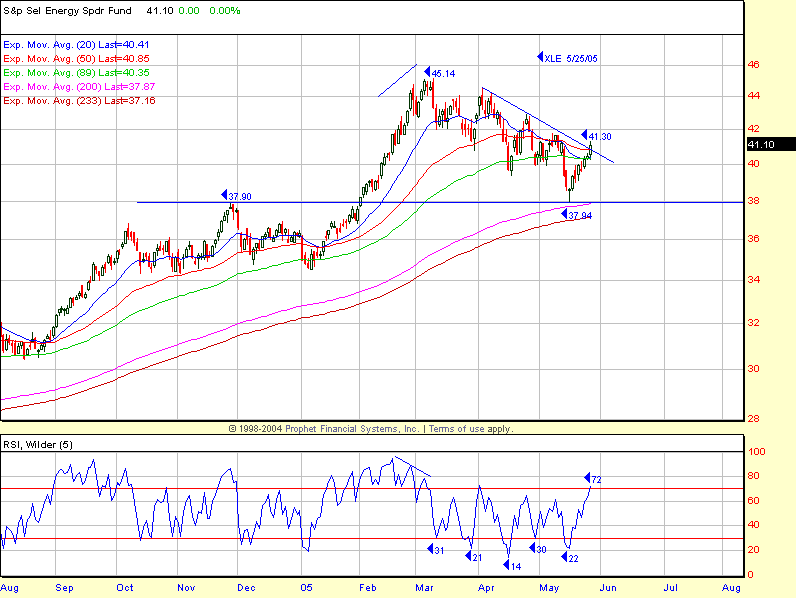
With the exception of the
(
OIH |
Quote |
Chart |
News |
PowerRating), +2.0%, and
XLE, +1.5%, all of the primary sectors finished red, in line with the major
indices, except the XBD, -1.3%.
(
GS |
Quote |
Chart |
News |
PowerRating),
(
MER |
Quote |
Chart |
News |
PowerRating) and
(
MWD |
Quote |
Chart |
News |
PowerRating) have been
unable to re-cross their 200-day EMAs in line with the major indices.
(
BSC |
Quote |
Chart |
News |
PowerRating),
always a rumored deal name, is trading above its longer-term moving average, as
is
(
LEH |
Quote |
Chart |
News |
PowerRating), which is very strong on the bond side.
The
(
TLT |
Quote |
Chart |
News |
PowerRating) — bond proxy — short trade was
initiated below 94.18 yesterday and kept because it closed in the money at
93.77. Sooner or later the CPI fraud will unravel, when in fact, almost
everything you use in your daily life is increasing in double digits, i.e.,
housing, health insurance, food, heating oil, etc. These are growing much faster
than individuals’ income, and a high-inflation/low-growth environment is
certainly not a good market scenario if it remains this way down the road.
Whatever else happens into month-end will be
today and Friday. The regulators frown on overt marking up of positions on the
last day of the month, so that day can often be a neutral to down day. The XLE
has made higher lows and highs for seven straight days since the
Generals’
Pullback entry after the 37.94 low and is +8.9% with the OIH +9.4%. Traders who
have both a short-term long position and also daytrade the energy stocks should
keep the stop on the XLE long trade no lower than 40.30 and should take 50% of
the current position profits right here (XLE closed at 41.10).
Have a good trading day,
Kevin Haggerty
P.S. I will be
referring to some charts here:
www.thechartstore.com in the future.

