Here’s How To Stack Trading Edges In Your Favor
Whether one uses technical analysis, fundamental analysis, or quantitative analysis, we’re all looking to do the same thing. Find the opportunities with the largest edges and look to profit from them while minimizing the risk.
Connors Research, and the research which preceded the forming of our company, has been publishing market strategies and edges since 1995. Markets have certainly evolved over the past nearly a quarter of a century and it has become harder for everyone to find market inefficiencies. In the 1990’s they were everywhere and you only have to look at the returns of the largest hedge funds from that decade to see just how large those edges were.
Today there are still edges in place but not where they were 25 years ago. The place where we see it the largest edges (and alpha) is when we stack multiple trading styles together.
In this issue of the Connors Research Traders Journal, we’re going to share with you a strategy which has outperformed the market by 6.5% a year since 2003 with less than half the market drawdown.
Stacking Edges In Your Favor
Before we look at the strategy let’s first put the framework in place which you can use for years to come.
The framework we use is called Quantamentals.
Quantamentals is a style of trading which has become popular with professional traders and especially with the largest quantitative hedge funds.
What Is Quantamentals?
Quantamentals is the combination of fundamental analysis, technical analysis, and quantitative analysis. While each of these has had historical edges, what you will see is that the combination of the three leads to greatly improved performance.
Combining fundamentals (F), technicals (T), and quant (Q) results in trading strategies with significant Alpha.
This combination often leads to performance which is much stronger than using any of these techniques by themselves. This is why some of the largest and most sophisticated hedge funds in the world are using this combination to manage portfolios.
Quantamentals in Action – Introducing the Quantamentals Value Strategy
In this strategy, let’s focus on value stocks or stocks that have relatively cheap valuations.
Value has had large underperformance over the past couple of years. What you will see, however, is that value (a fundamental indicator) combined with technical and quantitative analysis leads to greatly enhanced performance.
Here are the factors or edges we’ll apply in our Quantamentals Value Strategy.
- Fundamental (F) = Value. For Fundamentals, we will use Price / Sales as our value metric.
- Technical (T) = For Technicals, we will use the 100-day simple moving average for SPY.
- Quantitative (Q) = For Quantitative, we will use the 6-month momentum of the individual stocks.
Adding these three factors together results in a stronger performance than each factor on a stand-alone basis.
Here are the rules for our Quantamentals Value Strategy.
- Universe = Q500US. This is the 500 most liquid US stocks.
- (F) Value. We then take the 100 stocks with the lowest Price/Sales ratio. This is our Value screen. We are now left with 100 stocks selling at the cheapest valuations.
- (Q) Value Stocks With Strong Momentum. We then buy the 20 stocks (of our 100 value stocks) with the strongest 6-month momentum, skipping the last 10 days (to account for mean reversion over this shorter time frame). This means we are focusing on the cheapest stocks whose past 6 months performance has been the strongest,
- (T) Trend Following Regime Filter. We only enter new positions if the price of SPY is above its 100-day moving average.
- Rebalancing. This strategy is rebalanced once a month, at the end of the month.
- We sell any stocks we currently hold that are no longer in our low price/sales, high momentum list and replace them with stocks that have since made the list.We only enter new long positions if the trend-following regime filter is passed (SPY’s price is above its 100-day moving average).
- Any cash not allocated to stocks gets allocated the SHY (1-3yr US Treasuries)
Here are the results of this very simple Quantamentals strategy
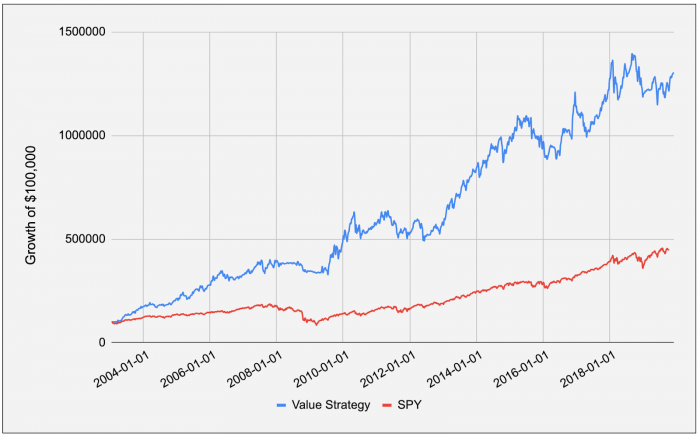
This simple Quantamentals Value Strategy handily outperformed SPY over the last 17 years.
What’s even more impressive is the fact that value stocks as a whole underperformed the S&P during this time. Yet this strategy, using price/sales along with technical analysis and quantitative analysis significantly outperformed the market and led to cumulative returns of 797.1% higher (plus 9% of Alpha!).
By combining fundamental analysis with technical and quantitative analysis, we now have a high performing strategy. This is the power of Quantamentals!
Here is the equity curve of the strategy vs SPY
Remember, this is just a simple example strategy to show you that the Quantamentals formula of F + T + Q leads to better investment results. You can go much further than this.
Learning More
In the webinar, we’ll teach you more about Quantamentals along with information on how you can further apply Quantamentals to your trading and investing.
To join the webinar, or to receive the recording, please click here now.
Larry Connors and Chris Cain, CMT


