Stand By To Stand By
No need
to spend much time on yesterday’s market because
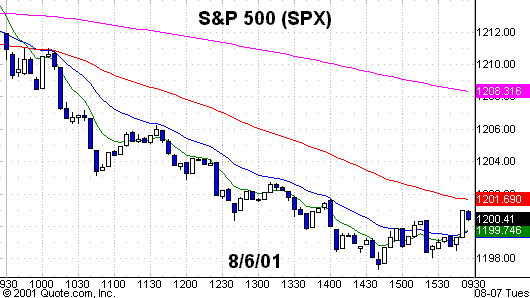
it was a one way down and the lightest full day of the year. The S&P 500
(
SPX |
Quote |
Chart |
News |
PowerRating)
ended -1.1% and the Nasdaq 100
(
NDX |
Quote |
Chart |
News |
PowerRating) -1.3%. The NYSE traded less than
75% of its average volume at 817 million of which 626 million was down. The
volume ratio was just 20. Decliners led advancers by 673. The Nasdaq was even
lighter, trading 1.1 billion or 60% of its average volume and a volume ratio of
33. Breadth also negative at -891.
It certainly wasn’t a
trader’s day as the NDX after a gap down opening, traded in the narrowest range
I can remember: 1719 on the high side and 1700 on the low. It finished in a
closing range triangle between 1709 and 1700. Nothing special happened in the
sectors as the SOX finished at -1.5% and the networkers at -1.7% and nothing
besides the XAU gold index on the plus.
Today we have the expected
decline in productivity and
(
CSCO |
Quote |
Chart |
News |
PowerRating) after the close. It’s amusing watching
the media hype build on CSCO. What can they possibly expect them to say? That
business looks great and we just had $1 billion worth of orders walk in the door
this month — and the world is OK again? Please. CSCO has gone from 82 in March
of 2000 to 13 this past April, closing at 19.54 yesterday. Those who believe
that CSCO is not going out of business can’t wait for a downside overreaction in
CSCO. FYI, it’s not going out of business.
|
(September
|
||
|
Fair Value
|
Buy
|
Sell
|
|
3.65
|
 4.85  |
|
Stocks
Today
In the semis, work the same
list as yesterday. There is more pullback expected after the recent rally.
You’ve got good news/bad news every other day. Take the intraday short setups if
you get them.
Yesterday, you even got some Trap Door longs after the gap down
openings like
(
KLAC |
Quote |
Chart |
News |
PowerRating) and then
(
NVDA |
Quote |
Chart |
News |
PowerRating)Â out of a consolidation above
86.80. NVDA climbed the down ladder all day, trading like there is anticipated
news or it’s being added to the S&P 500 or NDX 100. It should be, and could
replace some of those $5 dogs the NDX 100 now has.
Daily chart long setups —
and there aren’t many of them —
(
HCR |
Quote |
Chart |
News |
PowerRating),
(
BRCM |
Quote |
Chart |
News |
PowerRating),
(
ELNT |
Quote |
Chart |
News |
PowerRating),
(
IDTI |
Quote |
Chart |
News |
PowerRating),
(
ERTS |
Quote |
Chart |
News |
PowerRating),
(
VRTS |
Quote |
Chart |
News |
PowerRating) (which is in a Slim Jim on the daily chart — take it
either way),
(
IMCL |
Quote |
Chart |
News |
PowerRating),
(
ENZN |
Quote |
Chart |
News |
PowerRating),
(
GILD |
Quote |
Chart |
News |
PowerRating) (above Friday’s high),
(
CAH |
Quote |
Chart |
News |
PowerRating),
(
MYL |
Quote |
Chart |
News |
PowerRating),
(
WPI |
Quote |
Chart |
News |
PowerRating) and
(
QCOM |
Quote |
Chart |
News |
PowerRating).
On the short side:
(
SEBL |
Quote |
Chart |
News |
PowerRating),
(
CHKP |
Quote |
Chart |
News |
PowerRating),
(
MERQ |
Quote |
Chart |
News |
PowerRating), and
(
CIEN |
Quote |
Chart |
News |
PowerRating).
Have a good trading day.

Five-minute chart of
Monday’s S&P 500 with 8-, 20-,
60- and 260-period
EMAs

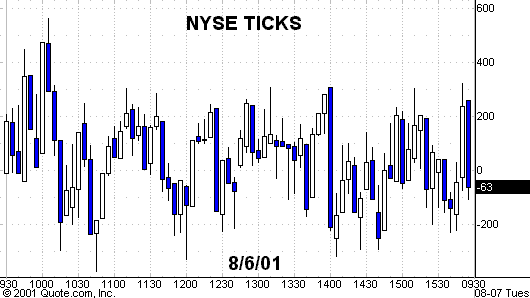
Five-minute chart of
Monday’s NYSE TICKS
Do you have a follow-up question about something in this column or other questions about trading stocks, futures, options or funds? Let our expert contributors provide answers in the TradingMarkets Trading Advisor! E-mail your question to questions@tradingmarkets.com.
For the latest answers to subscriber questions, check out the Q&A section, linked at the bottom-right section of the TradingMarkets.com home page.
