Stay in Touch With Your ETF Position By Trading Its Top Holding
In an earlier article, I suggested that one of the best techniques of predicting your ETFs upcoming price path is to watch the top three stocks in the ETFs holdings. The top holdings are the muscle stocks of the fund, and tend to fuel its primary trend.
ETFs Top Holdings Reveal Fund’s Internal Price Strength
Recently, I’ve expanded this technique into a trading strategy. When appropriate, I purchase (or sell short) a position in one of the top three holdings. I target the component that is forming the predominant trending pattern. It must also exhibit the best set-up to deliver short-term profits.
My goal: By actually holding a position in a stock, even a small position, I find I am much more in tune with the ETF and its potential price direction.
Some traders would call this a “pairs” trade. My goal, however, is not to buy one vehicle and sell short the other to profit from the divergence. Rather, my objective is to confirm the trend or price pattern of my primary and larger position, the ETF, by owning shares of its top movers. When I have “skin in the game,” I tend to stay more in tune with a position, and see the pattern more clearly.
For example, say I have a position (trend) trade in a sector ETF in my IRA. (I maintain a trailing stop, and I keep an eye on the sector and the ETF’s top holdings. But I don’t sit and watch the fund trade on an intraday chart.)
When that ETF encounters a support or resistance area, I evaluate charts of its main components. This works best when the top 2-3 components comprise a sizeable percentage of the ETFs total structure. (When I trade sector ETFs as my main trade, I often use the Select Sector SPDRS, as their top holdings are generally more heavily weighted, percentage-wise, than the iShares funds.)
Next, I target the holding that’s setting up as a high-probability intraday or swing trade. If conditions are appropriate, I enter the trade. Now, I feel more “in tune” with the ETFs internal price strength.
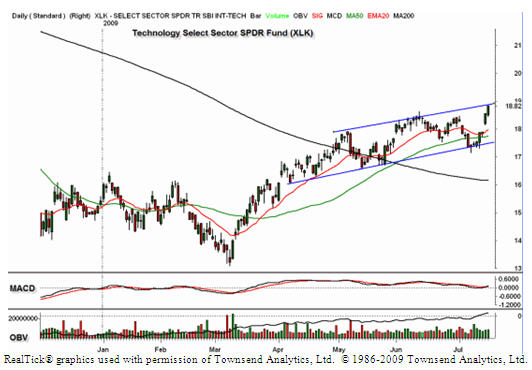
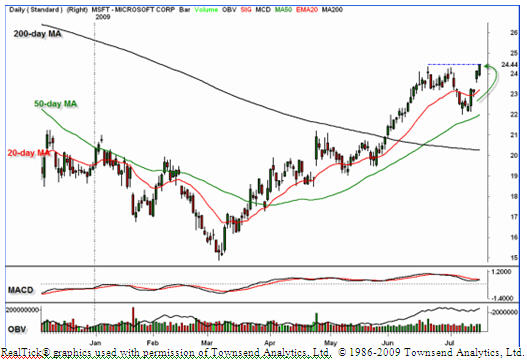
In the two charts that follow, you can see an example of an ETF / top component trade.
Figure 1: Technology Select Sector SPDR Fund XLK Daily Chart

Figure 2: Microsoft Corp Daily Chart

Traders holding position trades in the ^XLK^ might have felt dubious when the ETF moved to the bottom of its channel at the beginning of this month (July). The fund held its trend line low, however, and then bounced nicely back above its 50-day moving average.
For Some Traders, Getting “Skin in the Game” Helps Pattern Recognition
To get a true evaluation of the fund’s strength, traders holding the XLK would keep an eye on ^MSFT^ which is the XLK’s top holding, at 10.26% of the fund. MSFT never penetrated its rising 50-day MA during the pullback – a bullish sign.
Why not just buy MSFT for a trend trade, instead of the XLK? ETF’s are naturally diversified. Especially now, smack in the middle of earning’s season, it’s wise to lower risk in long-term positions by using ETFs.
If you check the top holdings of the XLK, you’ll note second and third top holdings are IBM Inc. and AT&T Inc. A daily chart of ^IBM^, shows the tech behemoth its pullback low of $100, then rocketed higher. ^T^ is struggling at a discount to its 50-day MA.
Now, let’s go back to the main XLK holding, MSFT. As soon as “Mister Softee” gained momentum off of its 50-day MA on strong volume, traders could buy a modest position with the intention of holding it for a swing trade or intraday trade. Goal: to monitor the strength of its momentum and relate it to the XLK. For the next three days, MSFT’s price action on an hourly chart shows the pattern to be orderly and positive. The gap up on July 15, and subsequent move up to overhead resistance, completes the run to the profit target for this short-term trade.
Mission Accomplished
Now, as you can see on the hard right edge of the chart, both the XLK and MSFT have reached potent overhead resistance. Swing traders would exit MSFT at their profit target, pocketing 10% or so gain. Those who like to sleep at night (again, this is earning’s season) might take a partial profit on the XLK IRA trade and raise the protective stop on the remainder.
What if Microsoft had told a different story? What if everything looked rosy at the entry, but then shortly thereafter, the software giant rolled to the downside and slid past the trade entry? As the top holding, MSFT’s weakness would indicate the fund’s internal strength was jeopardized. Wise traders would exit the MSFT trade and immediately manage risk on the XLK trade, as well.
To keep your ETF trades profitable, keep an eye on your fund’s top holdings. And to stay in tune with your ETF, consider trading one or two of its top holdings. Getting a little more skin in the game is can be a good way to keep green on your screen!
Toni Turner is a trader and investor with seventeen years of experience in the financial markets. She is the best-selling author of A Beginner’s Guide to Day Trading Online 2nd Edition, A Beginner’s Guide to Short Term Trading and Short-Term Trading in the New Stock Market. Toni has appeared on NBC, MSNBC, CNN, and CNBC. She has been interviewed on dozens of radio programs and featured in periodicals such as Fortune magazine, Stocks and Commodities, SFO, MarketWatch, Fidelity Active Trader, and Bloomberg Personal Finance.
Toni is the President of TrendStar Group, Inc.
