Stepping Up Your Fib – Part 3
The use of Fibonacci in
terms of market relationships gained popularity over the past decade, moving
from widespread use in the futures market to all forms of securities. In the
first two installments of this series on Fibonacci I covered the history of
Fibonacci series, the underlying basis for its popularity, as well as how to
draw and read Fibonacci levels in the market. In this third and final segment of
the series I will be moving from abstract concepts to practical uses for
Fibonacci in everyday market environments.
Utilizing Multiple
Fibonacci Levels
One concern with traders
when it comes to applying Fibonacci levels to a security is which trend moves to
focus upon. How does a trader determine which move is significant and which to
ignore?
In reality, every trend
move is important in determining another upcoming move in price, but there are a
couple of things to keep in mind. First of all, the larger the time frame under
examination, the more significant the support and resistance levels are on that
time frame. This applies to not only Fibonacci price support and resistance
levels, but any other form of price support or resistance as well. Another thing
to realize while dealing with these larger time frames is that each support or
resistance zone will be wider than on a smaller time frame. This means that they
will tend to be more elastic and not hold exact price levels perfectly.
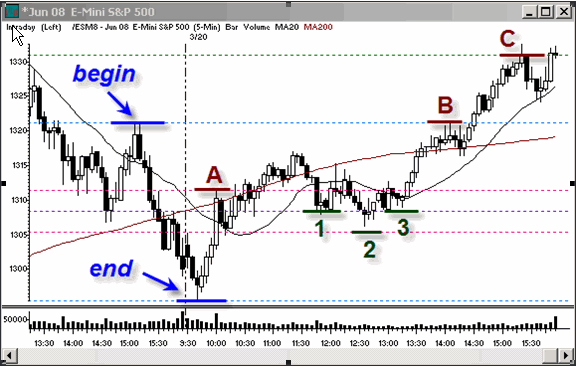
In Figures 1 and 2 below I
have drawn two separate sets of Fibonacci levels. The first set in Figure 1
shows the Fibonacci levels as they play out following the last major downside
move on the 5 minute chart of the S&P 500 EMini contract (ES) on 3/19 from
approximately 5:10 pm ET into 9:40 am ET on 3/20. The Fibonacci levels are drawn
by connecting the highs of the move to the lows the following morning. A, B, and
C are examples of the Fibonacci levels serving as resistance, while 1, 2, and 3
show mid-level support zones.
Figure 1- 5 Minute S&P
500 EMini (ES)
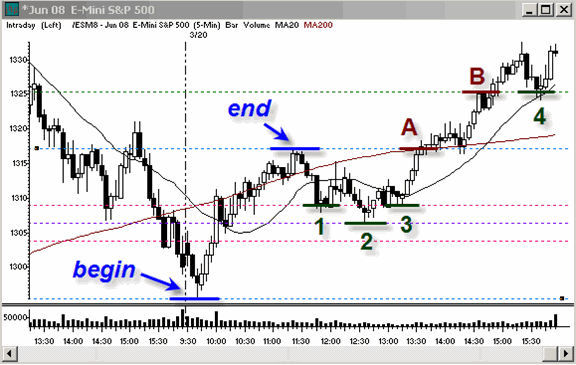
In Figure 2 the reversal
off the previous downtrend move is the primary focus and another set of
Fibonacci levels was drawn, connecting the lows of the price move on the morning
of 3/20 to the highs around 11:30 am ET. While A and B are both quite different
than they were in the first figure, 1, 2, and 3 are all in the mid-level area
once again. Each mid-day pivot low corresponded to a Fibonacci support level
based upon not only the move from the prior afternoon into lows, but also the
retracement levels which were based upon the move higher the following morning.
Figure 2- 5 Minute S&P
500 EMini (ES)
Although each of these
previous charts seems rather straight-forward, often the main trend upon which a
set of Fibonacci levels was established will move off to the left of the chart
as prices develop and no longer are displayed as new trend moves form.
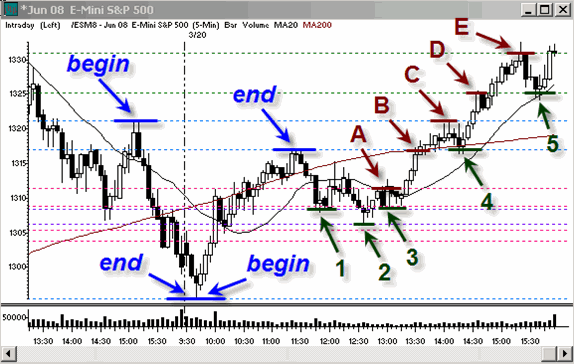
What these charts show,
however, is that even after a new move has formed, such as in Figure 2, the
Fibonacci levels from Figure 1 still remain valid. In order to view all of these
levels clearly as price action plays out, I typically will display several sets
of Fibonacci levels on the same chart, as I have in Figure 3. By giving the
different bands different colors, I can quickly discern how the price levels
relate to the original trends upon which they were based.
When more than one level is
hitting at approximately the same time, such as over noon on 3/20, those levels
are often quite strong.
Another way to weigh the
strength of a certain Fibonacci level is to look at other indicators or forms of
support and resistance. Those which correlate very highly to a certain Fibonacci
level will tend to be more significant.
In each of the charts in
this article I have included a 20 period and 200 period simple moving average.
The 200 sma acts as resistance on the morning of 3/20, hitting at the same
approximate time as the 61.8% Fibonacci retracement level from the prior
afternoon?s descent. It is resistance once again in the early afternoon, shown
as “B” in Figure 3. It doesn?t reverse prices in the ES, but in the Nasdaq 100
EMini (NQ) (not shown here) the prices pulled back at that same resistance point
to form a bull flag while the S&Ps congested.
In “5” on Figure 3 the 20
period sma hits at the same time as the -38.2% level from the morning rally,
allowing it to easily bounce back into the highs in the final minutes of trade.
Figure 3- 5 Minute S&P
500 EMini (ES)
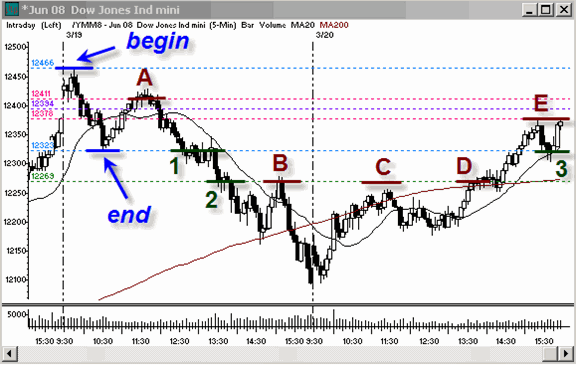
When using Fibonacci
levels, I will often keep a set of levels up for several days. Figure 4 shows a
move which took place on the morning of 3/19, before the prices in the earlier
examples even had a time to play out. What is important to notice, however, is
how much overlap there was in terms of where the Fibonacci levels from the first
drop on the 19th played out and how well they corresponded to
Fibonacci levels that would be based upon later trend moves.
For instance, “B” in Figure
4 is the same area where the move in Figure 1 began. It was the -38.2% level
from that morning’s drop.
“D” in Figure 4, is nearly
identical to “B” in Figure 3, while “E” is in the same zone on both charts.
“3” in Figure 4 is also
within just a couple of ticks from the “5” level in Figure 3.
When I have so many levels
up that it becomes overwhelming, I will clear my charts and update them with the
most recent relevant trend moves.
Figure 4- 5 Minute S&P
500 EMini (ES)
Fibonacci Levels, Gaps,
and News Environments
While Fibonacci levels work
very well in typical markets, they also hold well when circumstances are
less-than-normal and greater volatility, or news is at hand.
Figure 5 shows a set of
Fibonacci levels that are based upon a gap instead of the typical intraday trend
from the prior examples. By connecting the lows of the closing move to the highs
of the gap move, the -38.2% level from that gap predicted the morning highs.
Figure 5- 5 Minute S&P
500 EMini (ES)

3/18 was also a Fed day.
Despite the rapid whip-saw action following the interest rate cut announcement,
Fibonacci levels still held well. The 0% level was some initial support, but the
continuation into the 38.2% level was more significant, holding perfectly for
the rally into the close. Applying Fibonacci levels to gaps is a great way to
help figure out what the support or resistance levels are that fall in between
the closing and opening prices of the security, even when news is fueling the
retracement.
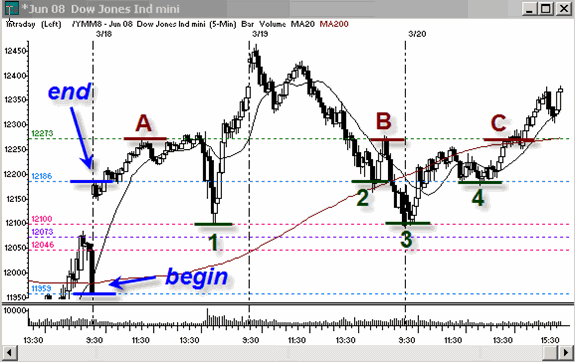
These levels also continue
to remain valid for days following the initial gap. This is shown in Figure 6.
Since each of the subsequent levels also lines up with prior highs or lows it
adds even more strength to them as support and resistance levels.
Figure 6- 5 Minute S&P
500 EMini (ES)
Other ways to Use
Fibonacci
Many strategies exist which
take Fibonacci series even further than the key concepts I have discussed in
this series. In addition to support and resistance, for instance, Fibonacci can
also be applied to time.
Instead of connecting highs
to lows to map out horizontal levels, some traders will connect them to map out
vertical levels to show time development and give them a heads up as to when a
new trend move is likely to turn.
Other uses for Fibonacci
tie into using them as moving averages, or even basing time frames and chart
setups upon them. I tend to think that chart configurations are more in the eye
of the beholder and it does not matter whether my tick chart on an ES is set up
based upon a Fibonacci number or a set number of ticks such as 200, but I’ll
leave that up to you!
To learn more about the
unique style of technical analysis I use for locating high probability trades, check out my Trading Made
Simple CD series at
www.swingtrader.net Please feel free
to email me with any questions or comments you may have by clicking on the
contact link located on my website at
www.tradingfrommainstreet.com.
Toni Hansen is one of the most respected technical analysts and traders in the industry with a high reputation for accuracy in both bull and bear markets. Her style of trading and market analysis transcends both time as well as market vehicles, making it attractive to investors and trader of stocks, futures, options, ETFs, and even the FOREX market. Toni is a frequent lecturer at trading clubs and industry expos. She is also a popular market columnist and is a repeat contributor to SFO Magazine. She recently co-authored High Profits in High Heels from Marketplace Books and SFO’s
Personal Investor Series book Online Trading.
