Stock Market Analysis and Fibonacci, Part 2
In part 1 TradingMarkets contributor John Jagerson discussed a few tactical concepts and tips to understand the Fibonacci Analysis. To see part 1 of “Stock Market Analysis and Fibonacci”, click here.
Through the beginning sections of this series of instructional articles I will be demonstrating the three most common fibonacci tools used by analysts. Once I have shown the tools used we will shift focus and start talking about how to apply these tools in real market situations. As with anything new, the best way to really internalize what you are learning is to use it. Experiment on your own with the tools you are learning about and start to look for those support and resistance lines yourself.
Fibonacci fans are very similar in concept to Fibonacci retracements and in many ways they are used the same way. Both are effective tools for identifying support and resistance levels, entries and exits, and stop and price target levels. Ultimately, you would try both and decide which works best for your trading style and analytical preferences.
How Fans and Retracements differ
1. Fans are more useful when a stock is trending, because they follow the trend diagonally rather than horizontally on the charts.
2. Fans will often stay valid longer than a Fibonacci retracement analysis because they accommodate a trend.
How Fibonacci Fans are Constructed

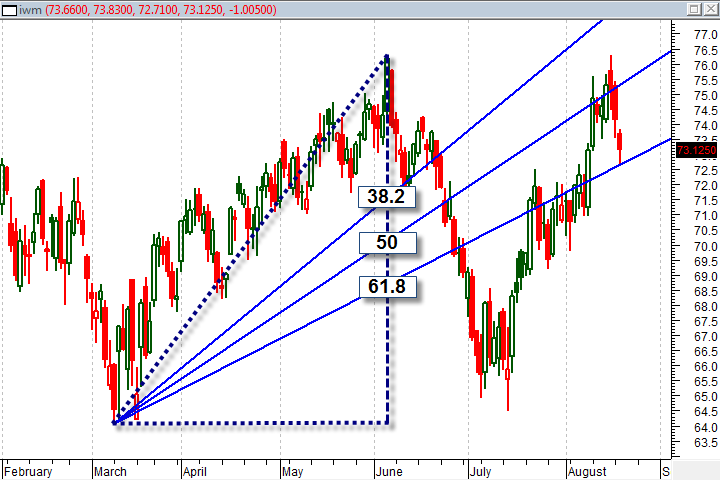
>The Fibonacci fan uses the same primary ratios of 38.2%, 50% and 61.8% that were discussed in the last section on retracements. The Fibonacci study is applied to the high and low of a trend in the same way that a Fibonacci retracement is placed. The diagonal fan lines are then based on an imaginary vertical line drawn from the top to the bottom price levels of the trend.
The fan lines are drawn from the bottom of the trend through the vertical line at its 38.2, 50 and 61.8% points. In the chart below you can see this how this would look if you could see those lines drawn on the chart.
Each level of the Fibonacci fan acts as a support and resistance line and is very useful when the market is trending because it will adjust to a long term trend. The lines create candidate support areas that can be used to enter a new trade in the direction of the existing trend. They are also useful as a warning for potential resistance areas that can be used to trigger tighter risk control or even to take some profits off the table.
How to draw Fans
The process for drawing Fibonacci fan lines is similar to Fibonacci retracements but because they accommodate the trend, they may have to be adjusted less frequently.
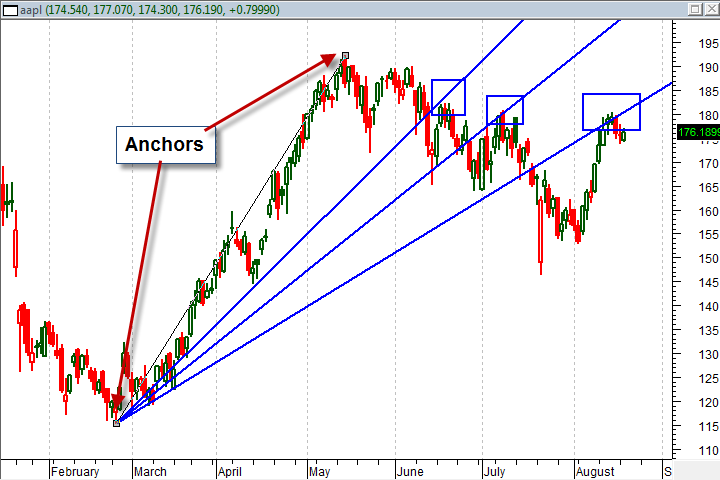
First, identify the trend by anchoring the Fibonacci fan study to the top or bottom of the trend you are identifying. In the example below, we will use the bottom on Apple (AAPL) in February as the first anchor point. The top that occurred on May 14th would have worked well as the second anchor for my Fibonacci rays. You can see the anchors and the subsequent areas identified by the fibonacci rays that would have identified short term resistance.

Here are a few tips that will help you better understand how Fibonacci fans work, and how you can begin experimenting with them in your own trading.
How to anchor Fans
Like a Fibonacci retracement analysis, determining where the tops and bottoms of the trend are is somewhat subjective. However, Fibonacci rays, like retracements, can tolerate a fair amount of variation as long as you are picking significant highs and lows.
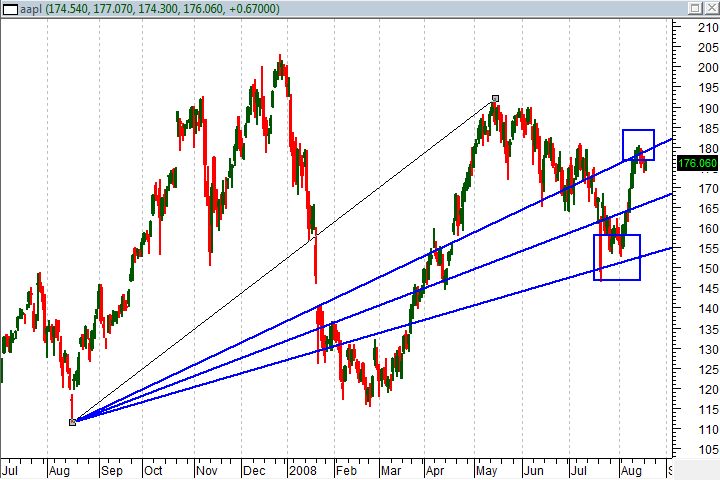
Here is an example of the same AAPL chart but rather than anchoring the bottom of the analysis with the February 2008 lows an analyst might have selected the significant bottom in August 2007. As you can see the fans lines were still very helpful in identifying the August 2008 top and bottom. Pretty neat, eh?

When to adjust the anchor points
Because fan lines are drawn to accommodate a trend you don’t “have” to move the anchor points until the trend moves outside, either above or below, the range of those lines. In the video we will look at a specific example of this kind of situation. Quite often the study will stay intact as long as the trend itself lasts.
Entry points and profit targets
The distance between fan lines becomes wider the further the trend extends. Be aware that this makes developing a consistent rule of thumb for entry points and profit targets more difficult than it is for Fibonacci retracements.
Don’t get too steep
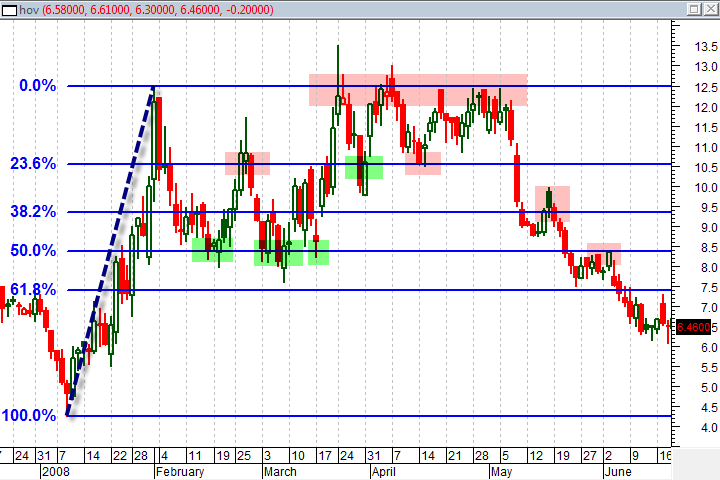
Not every analytical method will work in every situation. Very steep trends are not very conducive to this kind of analysis. In the chart below you can see the affects of this problem when the trend used to anchor the Fibonacci fan study was a result of a very fast moving market. The market almost immediately moved outside the range of the Fibonacci fan study and limited its usefulness.

Alternatively, very fast trends or corrections can be ideal situations for a Fibonacci retracement study to find potential areas of support or resistance. As you can see in the chart below, we could have gleaned some very valuable information from a retracement study in the same situation.

John Jagerson is the author of many investing books and is a co-founder of LearningMarkets.com and ProfitingWithForex.com. His articles are regularly featured on online investing publications across the web.
