Stock Market Analysis and Fibonacci, Part 3
Part 2 in our series discussed two of the three most common fibonacci tools used by analysts. Read Part 2 of “Stock Market Analysis and Fibonacci”. To also view Part 1, click here.
Fibonacci time studies are the last fibonacci tool I will introduce before we dig into the practical aspects of using fibonacci studies to time trades and assist in risk control.
Do you have the time?
Fibonacci analysis can be enhanced by using time projections. Fibonacci time forecasts are applied to a chart like other Fibonacci studies, and work best when combined with either a retracement or fan study. When you are in a trade, the time study will help you watch for points in which reversals or disruptions are likely to occur. When you are looking for new trade opportunities with a retracement or fan study, the time forecast can add to the probability of a successful outcome.
The fibonacci time study is the technical analysis equivalent to a fundamental analyst watching for upcoming earnings announcements or other scheduled releases. What you are looking for are those periods that have a high probability of disruption in the trend. That gives you the ability to control risk during those periods.
Time forecasts also add weight to potential support or resistance levels, and help identify when a bounce or change of trend could appear. Knowing where and when you may want to pay the most attention to your analysis is a great way to optimize your trading efforts.
A time forecast uses the Fibonacci number series (1,1,2,3,5,8,13,21…) to identify potential “areas of interest†in the future. They are applied very easily to a chart at a significant price bottom or top. Usually it is applied at the same price point you would use to attach the first anchor point of a Fibonacci retracement or fan study.
How it works
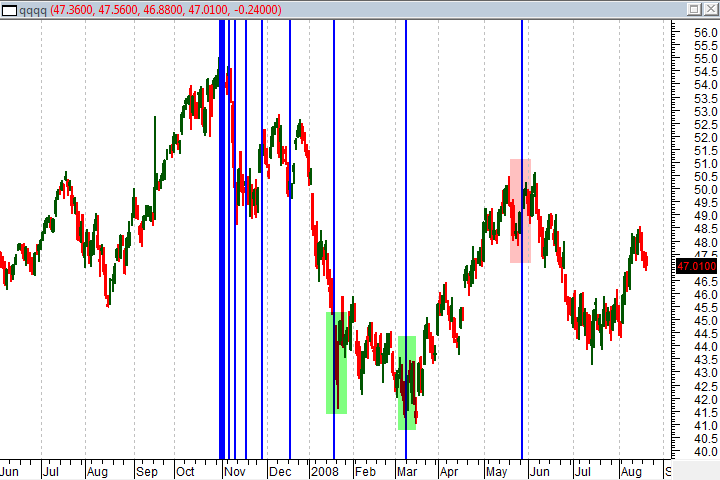
In the chart below you can see a time projection applied to the top of the October rally on the QQQQ.

Usually, you will ignore the first five very closely clustered vertical lines as noise (I will explain why a little later), and you will start paying attention to the wider spaced 6, 7, 8 and 9 lines. There are lines beyond that, but they begin trending out so far into the future that you will probably have updated your analysis by then.
As you can see, the time study below identified some likely volatility “nodes” where reversals may have been expected. In this case, the study proved accurate in the timing of three reversals.
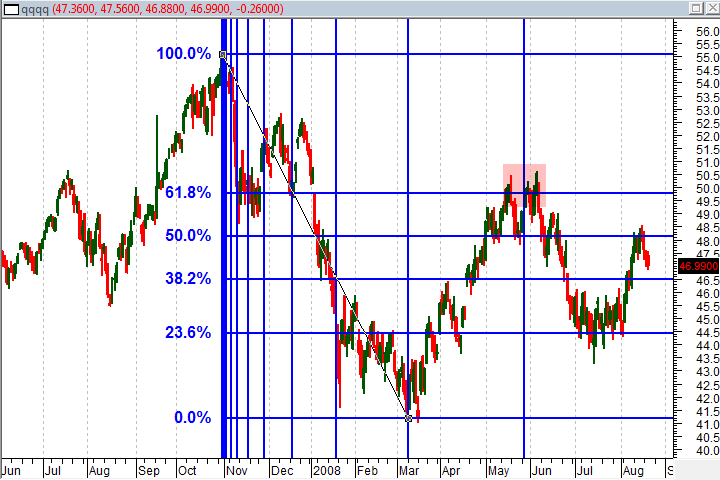
Combining the Fibonacci time projection with a Fibonacci retracement can help clarify the signals and make them more reliable. In the next chart I have left the time projection at the same point on the QQQQ but have layered a Fibonacci retracement anchored at the top in October and the low in March. The chart is getting a little crowded but with a little practice it isn’t too difficult to see the signals.

The time study coincided with prices touching the 61.8% Fibonacci retracement level at the very top of prices in late May and prices subsequently declined to the 23.6% retracement level. You will notice that the anchor or absolute low for this trend in March coincided with another time projection level.
The advantage provided by the time projection in this case study was that it let me know, in advance, when I should be paying the most attention to a potential resistance bounce. Any analytical method will fail a certain percentage of the time, but in my experience, the Fibonacci time projection helps to identify those opportunities with the highest probability for a successful outcome in advance.
How to draw time projection studies
I recommend the Fibonacci time projection be applied with a retracement or fan study. The time projection should be attached to the first anchor point of the retracement or fan study. Because the time projection lines or intervals are fixed, a second anchor point is not required. In the video you will see me apply the time study with a retracement and a fan study.
Ignore the first 5 intervals
Because the time projection is based on the Fibonacci number series the first interval will be drawn one candle away from the anchor, the second interval will be one candle beyond the first one, the third will be 2 candles away from the second interval, the fourth interval will be 3 candles from the third, the fifth interval will be 5 candles away from the fourth and so on…(1,1,2,3,5,8,13…)
The point behind this explanation is not only so you will understand how the Fibonacci time study is drawn but also so you can see that the first few intervals are not much more than static. Save yourself some effort and feel free to ignore them. The sixth interval is where we begin to analyze.
Planning a trade
You should design your trade in the same way you would if you were just using a Fibonacci retracement. Do not take more risk than you might normally, as trading is all about consistency and it is bad practice to radically change your position size from trade to trade.
Time projections and risk
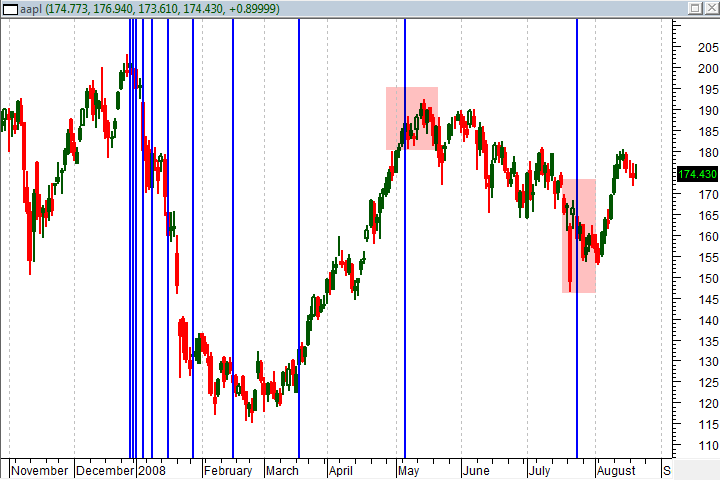
As with all Fibonacci studies, time projections can be a good warning that the current trend could be disrupted. That may be an excellent trigger to tighten stops or apply a hedge. In the example below, I have applied the time projection to a major top on AAPL. As you can see there were 2 subsequently significant retracements or volatility points that were identified by the time study. It does not mean that you have to get out of your trade just because a time projection interval appears, but it may be a great time to be more conservative in your risk control.

Variations in charting packages
At Learning Markets we make sure we have access to most of the popular charting packages and in almost all cases, Fibonacci time projections are drawn the same way. However, there are a couple of charting programs in which the programmers have misunderstood what a time study is and how it is used. The end result is that they will not project into the future but only cover the past. You can tweak them a little to get a good forecast into the future but if you find this tool useful for your own analysis you can find plenty of alternatives that will correctly display the information.
John Jagerson is the author of many investing books and is a co-founder of LearningMarkets.com and ProfitingWithForex.com. His articles are regularly featured on online investing publications across the web.
