• Free Book
  • Store
    • Books
    • Free First Chapters
    • Free Newsletters
  • Recent Articles

TradingMarkets.com

Quantified Stock Market Trading Strategies & Systems

  • Home
  • New Trading Research
  • Education
    • Articles
      • Connors Research
      • ETFs
      • Options
      • Stocks
      • Volatility
    • Trading Lessons
    • Connors Research
    • Glossary
    • Interview Archive
    • Videos
  • Python
  • Quantamentals
    • Quantamentals: The Next Great Forefront of Trading and Investing
    • Quantamentals Resources
  • Courses
  • Store
    • New Book! The Alpha Formula
    • “Buy The Fear, Sell The Greed” – Best Seller!
    • Swing Trading College 2019
    • Trading Books and Guidebooks
    • Street Smarts
    • Online Trading Courses
    • Private Mentoring with Larry Connors
    • Customized Trading Research
    • Amibroker Strategy Add On Modules
You are here: Home / Recent / Stock Market Analysis and Fibonacci, Part 4

Stock Market Analysis and Fibonacci, Part 4

November 12, 2008 by John Jagerson

In Part 3 TradingMarkets contributor John Jagerson discussed in our series discussed the third most common fibonacci tools used by analysts, fibonacci time studies. To see part 3 of “Stock Market Analysis and Fibonacci”, click here.

Putting fibonacci analysis into practice is challenging and to a certain extent depends on your trading time horizon. Short term traders may treat fibonacci analysis much differently than longer term investors.

However, in either case the analysis can help to time entries and control risk. Fibonacci analysis will work best within the context of a trend, which is not dissimilar to most types of trade timing analysis.

That means that looking for long trades or opportunities to buy stock during an uptrend is likely to be more productive than picking bottoms in a downtrend.

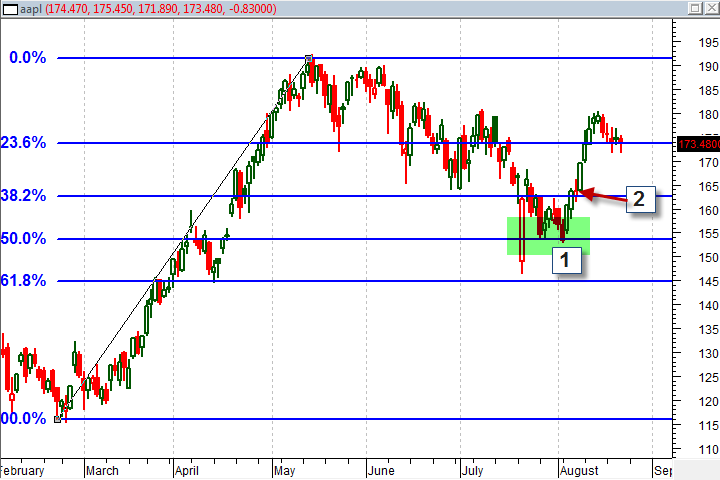
Fibonacci retracements can be used to find a buy opportunity when prices begin bouncing off one of the candidate fibonacci levels. In the chart below you can see a good example of this sort of timing solution on Apple
(
AAPL |
Quote |
Chart |
News |
PowerRating)
. I would approach this in two steps.

1. Look for the stock to stop or find support at one of the candidate fibonacci support levels.

2. Following the bounce off support and a break of the next fibonacci level enter long.
AAPL Chart2

I like this example because it includes a false start. If you are paying attention to the chart you can see that the stock bounced off the 38.2% retracement level then broke the 23.6% level in June-July before the signal I highlighted in July-August.

It is not uncommon for market prices to bounce from multiple levels before finally breaking out into the previous trend in the long term. What you are trying to do is to use fibonacci analysis to create a trigger to buy in an uptrend when the stock has a high probability of continuing to rise rather than randomly entering a given stock.

This means you may not always hit it at the right time but your probability of being able to enter the market when there is price momentum is now better than random. Using fibonacci like this also helps to create motivation to make a decision and take action.

John Jagerson is the author of many investing books and is a co-founder of LearningMarkets.com and ProfitingWithForex.com. His articles are regularly featured on online investing publications across the web.

Filed Under: Recent, Trading Lessons

Buy The Fear, Sell The Greed

Buy The Fear, Sell The Greed

Swing Trading College

New Book From Larry Connors and Chris Cain, CMT – "The Alpha Formula; High Powered Strategies to Beat The Market With Less Risk"

We’re excited to announce the release of a new investment book written by Larry Connors and Chris Cain, CMT. The book, “The Alpha Formula; High Powered Strategies to Beat The Market With Less Risk “ combines… Hedge fund legend Ray Dalio’s brilliant insight into combining uncorrelated strategies… With new, minimally correlated, quantified, systematic strategies to trade… [Read More]

Buy The Alpha Formula Now

Connors Research Traders Journal (Volume 57): 7 Real-World Reasons Why Short Strategies Should Be Included In Your Portfolio

In our new book, The Alpha Formula – High Powered Strategies to Beat the Market with Less Risk, we show the benefits of including short-strategies in your portfolio. As a reminder, building portfolios should be based on First Principles – otherwise known as truths. These truths are: Markets Go Up Market Go Down Markets Go… [Read More]

Company Info

The Connors Group, Inc.
185 Hudson St., Suite 2500
Jersey City, NJ 07311
www.cg3.com

About Us

About
Careers
Contact Us
Link To Us

Company Resources

Help
Privacy Policy
Return Policy
Terms & Conditions

Properties

TradingMarkets
Connors Research

Connect with TradingMarkets

Contact

info@cg3.com
973-494-7311 ext. 628

Free Book

Short Term Trading Strategies That Work

© Copyright 2020 The Connors Group, Inc.

Copyright © 2023 · News Pro Theme on Genesis Framework · WordPress · Log in