Stocks wrapped up a strong week with gains
Stocks
concluded a strong week with another session of gains last Friday, as
the S&P 500 approached resistance of its 52-week high. The market
gapped firmly higher on the open, but drifted sideways to lower
thereafter. The S&P 500, Nasdaq Composite, and Dow Jones Industrial
Average each gained 0.3%, while the small-cap Russell 2000 advanced
0.2%. The S&P Midcap 400 Index was the only broad-based index we
follow that finished lower, but it lost only 0.1%. The Nasdaq gave back
much of its intraday gain, but still managed to close higher for the
sixth consecutive day.
Despite
strength in most sectors, the S&P Select Utilities SPDR
(
XLU |
Quote |
Chart |
News |
PowerRating) still
lost 0.7%, pushing our short position further into the plus column. XLU
also closed below its 50-day moving average for the first time since
May 24 of this year, so a change in bias is definitely taking place in
the Utilities sector. Our long position in the StreetTRACKS Homebuilders
(
XHB |
Quote |
Chart |
News |
PowerRating) is also working well, as XHB rallied 2.1% on Friday
and closed at its highest price since July 3. The iShares Russell 2000
(
IWM |
Quote |
Chart |
News |
PowerRating) short position is still against us, but remains below our
original stop.
Turnover
in both exchanges surged to its highest levels in months last Friday,
but much of the volume increase can be attributed to the quarterly
“quadruple witching” options expiration day. Total volume in the NYSE
increased by a humongous 51% over the previous day’s level, while
volume in the Nasdaq was 33% higher. On the third Friday of the last
month of each calendar quarter, stock index futures, stock index
options, stock options and single stock futures (SSF) all
simultaneously expire. The associated closing of stock positions in the
market typically results in a volume spike on every such “quadruple
witching” day. Nevertheless, the gains on higher volume caused both the
S&P and Nasdaq to register bullish “accumulation days.” The only
negative was that each of the major indices closed near the bottom
third of their intraday ranges. This tells us that much of the rise in
turnover may have been attributed to institutions selling into strength
of the opening gap up.
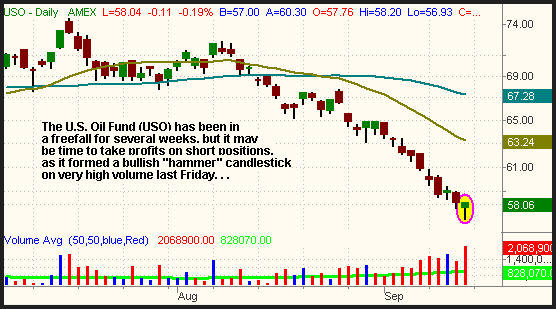
Over the
past few weeks, we have been discussing the weakness in oil-related
ETFs, particularly the short position in the S&P Select Energy SPDR
(
XLE |
Quote |
Chart |
News |
PowerRating) that the Morpheus Capital fund recently profited from. If you are
still short any of the energy ETFs, you are probably sitting on a nice profit,
but you may want to consider lowering your stop to just above Friday’s highs in
order to protect your gains. The main reason we suggest this is the bullish
“hammer” candlestick formation that has formed on the daily chart of crude oil.
Note the “hammer” on the chart of the U.S. Oil Fund
(
USO |
Quote |
Chart |
News |
PowerRating), which loosely mirrors the price of crude
oil. Also notice the high volume in last Friday’s session, often
indicative of a climatic move to the downside:
More of my thoughts on the technical state of oil appear in the Exchange Traded Funds section of today’s Investors Business Daily newspaper. You can read the article by clicking here.
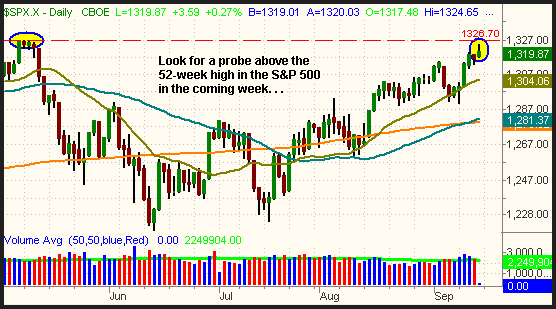
After
the first hour of last Friday’s session, the S&P 500 was trading
within 0.2% of its 52-week high that was set back in May, but the rally
fizzled out later in the afternoon. Still, it is likely that traders
will at least make another test of the 52-week high in the coming week.
Whether or not the index manages to actually close at a new
high is the big question, but we should at least see an intraday probe
above the high. The horizontal line on the daily chart below marks the
magic number of that resistance level:
When
an index is trading near a pivotal support or resistance level, trading
conditions often become erratic and whippy. As such, you may want to
hold off a few days on entering new trades on both sides of the
market until we see how the S&P reacts near this closely-watched
level. As long as stocks continue to consolidate near their highs,
there is no need to take profits on any long positions, but you should
at least consider trailing your stops tighter. In situations such as
these, we like to use the hourly timeframe and place protective stops
just below support of the hourly uptrend lines on long positions. As
for short positions, don’t be sloppy with your stops because a new high
in the S&P could instantly trigger a lot of bullish momentum that
propels stocks much higher. If short, just be sure you are in sectors
with relative weakness, such as Utilities or Energy, as these would be
the last sectors to move higher if the market does.
Open ETF positions:
Long XHB, short XLU and IWM (regular subscribers to The Wagner Daily
receive detailed stop and target prices on open positions and detailed
setup information on new ETF trade entry prices. Intraday e-mail alerts
are also sent as needed.)
Deron Wagner is the head trader of Morpheus Capital Hedge Fund and founder of Morpheus Trading Group (morpheustrading.com), which he launched in 2001. Wagner appears on his best-selling video, Sector Trading Strategies (Marketplace Books, June 2002), and is co-author of both The Long-Term Day Trader (Career Press, April 2000) and The After-Hours Trader
(McGraw Hill, August 2000). Past television appearances include CNBC,
ABC, and Yahoo! FinanceVision. He is also a frequent guest speaker at
various trading and financial conferences around the world. For a free
trial to the full version of The Wagner Daily or to learn about Deron’s other services, visit
morpheustrading.com or send an e-mail to
deron@morpheustrading.com
.