Strategy Guide
As part of your Volatility Band service, I will provide timely commentary
with examples so that you can understand the logic and thought process that will
help you maximize the power of the bands.
Fibonacci Extensions with Volatility Bands
The Fibonacci extensions you will use most in conjunction with
daily Volatility Bands are:
1.00
1.27
            1.414 (minor)
 1.618
2.00
2.24
 2.618
It is rare when you go past the 1.618 extension and that is only
on a few powerful trending days.
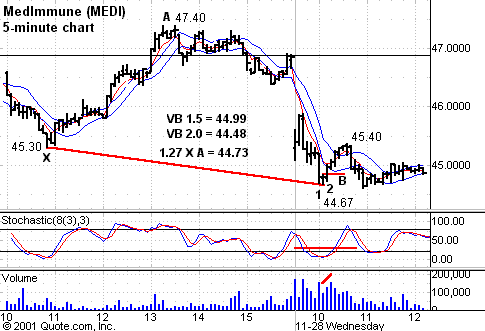
Example: MEDI

(This is a five-minute chart
of MEDI with 8-period SMAs of the high and low. You also use a five-period EMA of the
last.)
The indicator used is an 8,3,3 slow stochastic, which is
excellent for five-minute charts.
Sequence:
-
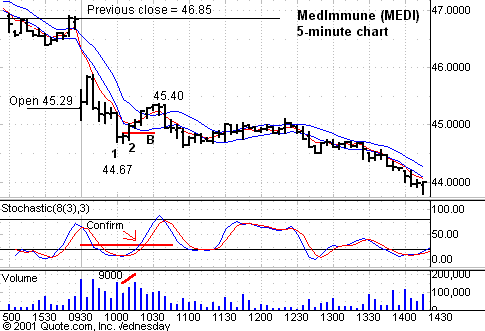
On 11/28, MEDI opened down at 45.29 vs. its previous close
of 46.85. -
It traded down to 44.67. The 1.27 Fib extension of the
previous day’s up leg “XA” from 45.30 to 47.40 is 44.73. -
The 2.00 band is 44.48, and the 1.5 band is 44.99.
-
The low bar (1) is a narrow-range bar with close and
open the same and above the midpoint (doji). -
This doji, in confluence with the 1.27 extension of “XA“
and almost at the 2.00 (95% probability) band, made it a high-probability
trade. -
Entry was above the high of the low bar (2), which is
44.85. -
MEDI only ran to 45.40 before failing, but the trade was
well taken, and at worst case, you broke even or made a small amount.

Key Point
This trade was at the volatility band, in
addition to a Fibonacci extension and you had a defined entry pattern.
When you combine sequence trading with
volatility bands, it is a high-probability trade with excellent reward to risk
because your stop is close to your entry point.
