Sugar: A Sweet Market On The Move
Sugar is an often overlooked commodity by the trading public. It tends to move in long sweeping slow trends, however recently it has become quite active. There are many factors involved causing the increased price movement; however the primary one appears to be ethanol usage. Ethanol is a fuel additive made from sugar.
As oil prices rise, ethanol becomes more cost effective relatively, and thus, is used in greater percentages in gasoline. However, when oil prices pull pack from the current raging uptrend, ethanol is not as attractive as an additive, resulting in less use/demand. This in turn, affects the supply/demand dynamics of sugar, resulting in price volatility within the commodity.
For example, just today, sugar futures dropped dramatically in London, on expectations that a decline in oil prices will result in less demand for ethanol. This is after a 22% increase in sugar prices in 2008, caused by oil’s advance and a tumbling United States Dollar. Fundamentally, there are some exciting things happening right now in sugar. Let’s take a deeper look at the sweetest commodity future and how it trades.
Sugar is one of the world’s top 10 traded commodities and is produced in over 120 countries for food, fuel and various industrial uses.
Sugar is traded on both the LIFFE and ICE exchanges. For the purposes of this article, I will focus on the ICE traded contracts.
The primary sugar contracts are sugar 11, 14 and 16. Sugar 14 is the contract currently used for hedging. However, in September 2008, it will be phased out and replaced by Sugar 16. Sugar 11 is known as “World Sugar†and is the most actively traded contract. It is considered the benchmark for sugar prices.
The sugar 11 contract is relatively small compared to that of 14 and 16, hence it is attractive to smaller speculators and traders who wish to access the sugar market. Sugar 11’s ticker symbol is SB and the contract size is 112,000 pounds or what is called 50 long tons.
Contracts are listed in the months of January, March, May, July, and October. SB moves in 1/100th cent per pound which translates into a tick size or minimum movement of $11.20/contract. There is no exchange imposed daily price limit and ICE charges $1.75 per contract as an exchange fee for non exchange members.
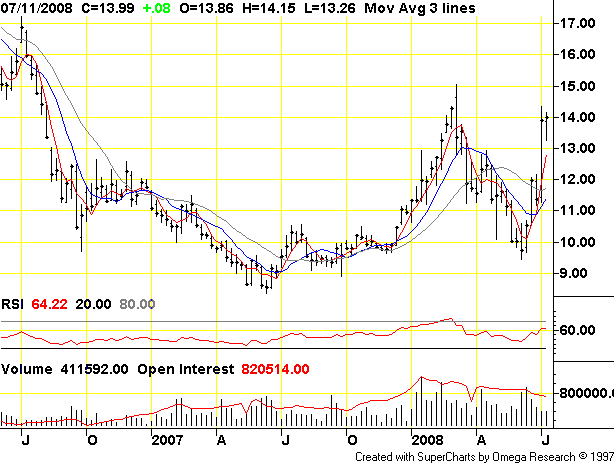
Let’s take a look at the daily technical picture of the SB sugar 11 contract. As you can see from the weekly chart, price spiked up in the beginning of 2008, pulled back and now appears to be heading back to the yearly highs. It has pulled back in London today and fallen a little in ICE trading since the opening.

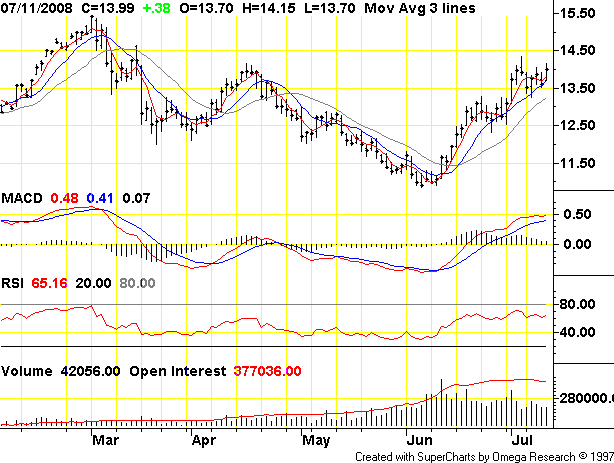
The daily chart indicates a nice uptrend with price riding up the Simple Moving Averages. The RSI and MACD indicators seem to show further upside is possible here. If you believe oil hasn’t finished its up move and like buying on pullbacks from trends, sugar looks like a sweet trade here.

David Goodboy is Vice President of Marketing for a New York City based multi-strategy fund.
