Super-Regional Banks
One of the lead dogs in
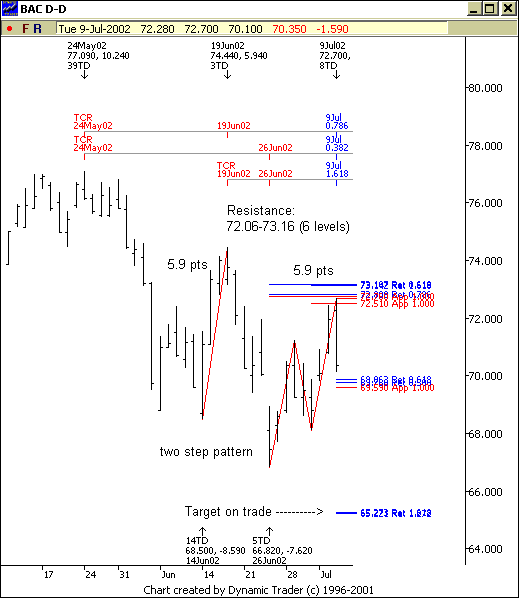
this sector is Bank of America (BAC). This stock was enjoying a nice run up
to May 24. However, since that date, (BAC) has begun a sell off. In fact, today,
BAC was aligning on all of my parameters for a trade (and still is).
1. The immediate trend
is now down
2. 3 time cycles were
pointing to a potential cycle high
3. Fibonacci price resistance
from 72.06-73.16
4. Price symmetry of the
corrective rallies
a.
The previous rally was 5.9 pointsb. As of today
this rally from the June 26 low hit 5.8 points
5.
Pattern
a.
BAC formed a two step pattern into our price resistance zoneb. Elliot wavers
might refer to this as an A-B-C correction
So, with all of these parameters
lining up we walked into today’s session looking for a potential short. We got
the opportunity and BAC traded down over 2.5 points from today’s high. In fact
it has now formed a bearish engulfing pattern for you “Stick” people.
My objective on this trade
is the 65.25-.30 area. That’s because this is the 1.272 Fibonacci extension
of the June 26 low to July 9 high. However, before this price area is even within
reach
(
BAC |
Quote |
Chart |
News |
PowerRating) has to deal with a Fibonacci price support zone from 69.59-69.86.
If this zone is violated to the downside, then there is a high likelihood my
objective will be hit. If this support zone holds then I will consider getting
out of the position. Regardless, I will be taking partial profits around this
immediate support zone and trailing my stop to reduce risk.

Â
Good evening!
Â
Â
Â
Â
Â
Â
