Temporary Resistance
On Tuesday, both
the Dow and the S&P hit Fibonacci resistance levels on a Fibonacci
time zone, and they have both started what is probably a temporary decline off
of these levels in slightly overbought regions. While a broad number of indexes
and sectors have broken out of either head-and-shoulders bottom formations or
cup-and-handle consolidations, the market remains less than all-out bullish in
terms of breadth. The A/D line is moving up nicely, but new highs over new lows
are very substandard. The lack of volume or breadth thrusts is unique to any
bull move of significant duration since 1900. The Dow experienced similar
sub-par breadth from 1975 to early 1976 and from mid-1980 to early 1981. These
bull moves led to some leading indexes and leading sectors making significant
new highs, but not to new highs in many groups as well. My suspicion is
that we’re in a bull move that will be as volatile and less inclusive than any
since the 1980-81 bull move that was an interlude to a double-dip recession.
More breadth in terms of volume and new highs
over new lows would help remove this troubling and lingering suspicion. It is
not just sub-par breadth/thrust statistics that have me concerned. It is also
the leadership. The good news is that there is clearly new leadership. This is
where stock investors should FOCUS any new investment allocation. The new
leadership is value stocks, resource stocks, energy, construction, pollution
control, gaming, some retail, some transportation and some real estate. However,
whenever precious metal stocks start to breakout and leading sectors are
resources, energy, real estate and smaller caps, liquidity cycle theorists
should start to get nervous. These are all sectors that benefit from increasing
inflation, and typically, they come to the fore toward the end of an economic
cycle, not the beginning. For these sectors to be so clearly signaling
leadership makes me wonder how long this cycle can continue and whether
Greenspan hasn’t been too aggressive. Investors need to watch gold stocks and
inflation indicators carefully because more inflationary pressures, along with
higher metals prices, will pull the punch bowl away before this recovery party
even has much of a chance to get started.
Another concern is earnings. Asia has had a
relatively profitless recovery as it has tried to unwind its overcapacity
problems since 1998. Monetary stimulus has done very little to speed up the
utilization and correction of excess capacity. It has become clear that certain
segments of the U.S. economy have excess capacity problems. One has to wonder if
monetary stimulus, no matter how aggressive, will do much to solve this problem
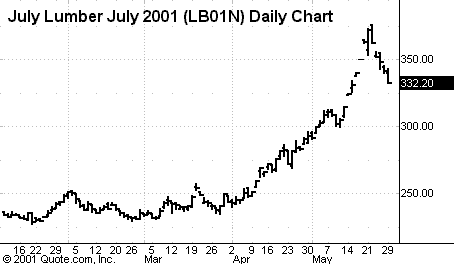
or to help earnings in companies in these sectors. Lumber’s explosion is also
troubling. Finally, breadth on our Top RS New Highs list breakouts remains okay,
but far from outstanding. Until we get more opportunities and until earnings and
inflation problems become clearer, I am not going to get all out aggressive
about upping exposure to this market.
Let’s
look at some numbers from the week. New
Highs vs. New Lows on our RS/EPS lists were
30/2, 53/3, 53/2 52/0 and 23/0 — again this week, new highs are certainly dominating, but they
are not soaring as we would expect in a new bull market with numbers above 50
daily and above 100 a time or two. The bull side offers more opportunities certainly,
but this is not a
slam-dunk easy-money environment yet. Lows remain almost non-existent. There
were roughly 15 breakouts on the upside to new highs of stocks on our Top RS/EPS
New Highs list, with only two close calls this week, with only two breakdowns on the downside of
four-week-plus consolidations on our Bottom RS/EPS New Lows list, including no close
calls.
Close calls are stocks almost meeting our criteria that broke out of sound
bases. Of course, a truly good environment would show five or more times this number
of breakouts with dozens of close-calls or stocks actually meeting our criteria
breaking out. So while long opportunities grow, and there is nothing right now
on the short side, the environment is not yet
nearly optimum on the long side either.
Our
overall allocation is still relatively DEFENSIVE with 0% short and 31% long and the
remaining 69% in T-bills awaiting new opportunities. Our model portfolio followed up weekly in this column ended 2000 with
about an 82% gain on a 12% maximum drawdown, following a gain of around 41%
the prior year. For year 2001, we
are now up about 5%, with a mostly cash position, though we had our best week
all year from existing positions.
For
those not familiar with our long/short strategies, we suggest you review my
10-week trading course on TradingMarkets.com, as well as in my book “The
Hedge Fund Edge” and course “The Science of Trading.“Â
Basically we have rigorous criteria for potential long stocks that we
call “up-fuel,” as well as rigorous criteria for potential short
stocks that we call “down-fuel.” Each day we review the list of new highs on our “Top RS and EPS New
High list” published on TradingMarkets.com for breakouts of four-week or
longer flags, or of valid cup-and-handles of more than four weeks. Buy trades are taken only on valid breakouts of stocks that also meet our
up-fuel criteria. Shorts are
similarly taken only in stocks meeting our down-fuel criteria that have valid
breakdowns of four-plus-week flags or cup-and-handles on the downside. We continue to buy new signals and sell short new short signals until our
portfolio is 100% long and 100% short (less aggressive investors stop at 50%
long and 50% short). In early March
of 2000 we took half profits on nearly all positions and lightened up
considerably as a sea-change in the new economy/old economy theme appeared to be
upon us.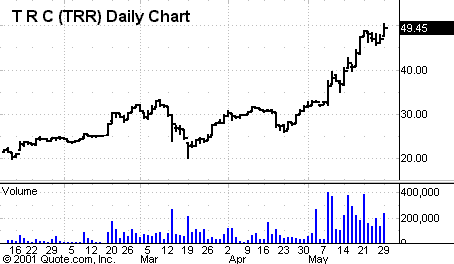
Upside
breakouts meeting up-fuel criteria (and still open positions) so far this year
are: Atlas Pipeline
(
APL |
Quote |
Chart |
News |
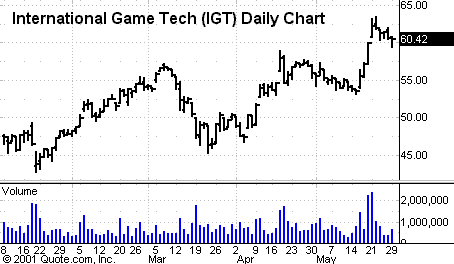
PowerRating) @28 (43.5) w/36.5 ops; and International Game Tech
(
IGT |
Quote |
Chart |
News |
PowerRating) @57.95 (61.24) w/53 ops; and TRC
(
TRR |
Quote |
Chart |
News |
PowerRating) @36.32 (46.8) w/39
ops. At least we have profits locked in on two out of three positions here.
Continue to
watch our NH list and buy flags or cup-and-handle breakouts in NH’s meeting our
up-fuel criteria — but continue to add just two per week and only in leading
groups.
On
the downside, this year we’ve had breakdowns from flags (one can use a down
cup-and-handle here as well) in stocks meeting our down fuel criteria (and still
open positions) in: no open positions.
Continue to watch our NL list daily and to short any stock meeting our
down fuel criteria (see 10 week trading course) breaking down out of a downward
flag or down cup-and-handle. Here
too, remain cautious by only adding two shorts in a week, until we get
more consistency in the number of downside breakouts in a given week off of our
Bottom RS/EPS New Lows lists.
When valid breakout of up-fuel or down-fuel
stocks become abundant again, we’ll pounce with both hands — for now we’ll
gently ease in unless the environment begins to improve. If this is a REAL bull
market, breadth will improve, new highs meeting fuel criteria will broaden, and
we’ll catch up to the averages easily by buying quality breakouts. If this is
not a real bull market, we’ll get a situation like we had last year from March
through September — where we make some money with some allocation to longs, but
the bull never really takes off, and we are able to lock in profits without
getting faked out. One of the toughest things for traders and investors to do is
to not worry about missing a bottom. Bottom-picking is not the path to reliable
and consistent strong gains! What is the path is pouncing on reliable
opportunities when they develop and waiting for reliability before committing
much capital.