That Time of Month & 5 PowerRatings Stocks
In our never ending effort to refine our stock picking edge, we looked at stock performance on a daily basis during the month. What was discovered is quite remarkable. Starting with a sample size of 8 million trades conducted between January 1995 and December 2007, and then broken down per day of the month. The questioned asked was, “If every stock was bought today, how would have the performance been over the next 5 trading days?”
It turned out that the average gain for all days of stocks above their 200-day Simple Moving Average was 0.25% for the 5 days.
What is most fascinating is that from the 23rd day of the month to the final day there is a significant increase in the average gain! It was also discovered that between the 3rd and the 8th day of the month stocks on average have lost money. I bet you can see the edge developed with these studies. You can read the details on this research in Larry Connors’ book, “Short Term Trading Strategies That Work“.
Getting down to the nitty-gritty of how to apply this information. We have developed an easy to use, 3 step system for locating stocks ready to outperform in the short term regardless of the time of month. However, when applied near the end of the month, our research indicates that the edge created is even greater.
This article will explain the 3 steps and provide 5 stocks meeting the criteria for your consideration.
The first and most critical step is to only look at stocks trading above their 200-day Simple Moving Average. This assures that a strong, long term up trend is in place, increasing the odds that you are not buying into a falling knife or catching a stock in a death spiral.
The second step is to drill deeper into the list locating stocks that have fallen 5 or more days in a row or experienced 5 plus consecutive lower lows. Yes, you heard me right, fallen 5 or more days in a row. I know this is counter-intuitive of conventional wisdom of buying stocks as they climb higher. However, our studies have clearly proven that stocks are more likely to increase in value after a period of down days than after a period of up days.
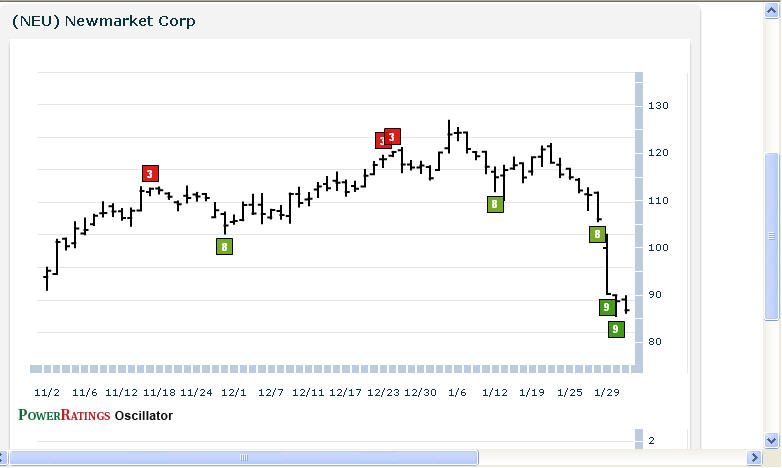
The third and final step is a combination of whittling the list down even further by looking for names whose 2-period RSI (RSI(2)) is less than 2 (for additional information on this proven indicator click here) and the Stock PowerRating is 8 or higher.
The Stock PowerRatings are a statistically based tool that is built upon 14 years of studies into the inner nature of stock prices. It ranks stocks on a scale of 1 to 10 with one being the most volatile and least likely for short term gains and 10 proven to be the most probable for gains over the next 5 days. In fact, 10 rated stocks have shown to have a 14.7 to 1 margin of outperforming the average stock in the short term.
The stocks that fulfill each of the above steps have proven in extensive, statistically valid studies to possess solid odds of increasing in value over the 1 day, 2 day and 1 week time frame.
^BBBB^
^COO^
^FUN^
^INWK^
^NEU^

Learn more strategies for trading stocks in the short term with a free trial to our PowerRatings! The highest rated stocks have outperformed the average stock by a margin of more than 14.7 to 1 after five days! Click here to launch your free PowerRatings trial today!
David Goodboy is Vice President of Business Development for a New York City based multi-strategy fund.
