The Relative Strength Momentum Edge
In last week’s Connors Research Trader’s Journal, we discussed the low volatility edge. This is the empirical observation that stocks with lower historical volatility tend to outperform stocks with higher historical volatility through time.
Today we are going to present another edge to incorporate into your trading and investing models – relative strength momentum.
While no edge or factor in isolation produces compelling results, combining multiple edges into a complete trading system does lead to very good results.
This is one of the main takeaways from our recent Quantamentals course, where we combined several edges found in Fundamental Analysis, Technical Analysis, and Quantitative Analysis to build high performing trading and investing models.
What is Relative Strength Momentum?
Relative strength momentum is the tendency of assets that have had the strongest performance in the recent past to continue to outperform going forward and assets that performed the worst over the recent past tend to continue to underperform.
This type of momentum, also called cross-sectional momentum, compares the performance of an asset to the larger universe of assets. This is related, though different, than time-series momentum, which looks at an asset’s performance compared to its own past history.
An example of a relative strength momentum rule would be to buy the 50 stocks in the S&P 500 with the best trailing 6-month total returns (momentum). Notice that we are comparing the returns of the stocks to returns of the other stocks in the universe. Said another way, we are comparing performance in a relative way. This is relative strength momentum.
Academic Evidence
Relative Strength momentum has been very widely studied in the academic literature over the last 25 years.
The seminal study on the momentum effect was conducted by Narasimhan Jegadeesh and Sheridan Titman in their 1993 paper – “Returns of Buying Winners and Selling Losers: Implications for Stock Market Efficiency.” This paper formed long/short portfolios based on past performance (momentum), showing large outperformance that was not able to be explained by existing academic models.
After this initial seminal study, which brought the relative strength momentum effect into the minds of financial market academics, there have been many other studies examining this phenomenon.
Relative strength momentum has proven to be robust in individual US Stocks, individual foreign stocks, equity indexes, government bonds, currencies, and commodities. It has been found to work for over 100 years, through many different market and regulatory environments.
Relative Strength Momentum Test
For our relative strength momentum test, we will sort the 500 most liquid US stocks by the trailing total return over the last 6 months, skipping the most recent month. Momentum has been shown to be robust in the 3-month to 12-month lookback periods, so our 6-month lookback parameter is well within this range.
Why do we skip the most recent month? This is standard in research when studying relative strength momentum. This is done to take into consideration the well-known mean reversion effect of stocks over this shorter time frame.
In fact, Connors Research has been publishing research on this short-term mean-reversion effect for decades. By measuring momentum by the total return over the last 6-months, skipping the last month, we account for this effect.
In the test below, we simply rank each of our 500 stocks by 6-month momentum (skipping the last month) every month from 2003 to September 2019. We systematically invest in either the top 50 stocks or the bottom 50 stocks based on this momentum measure.
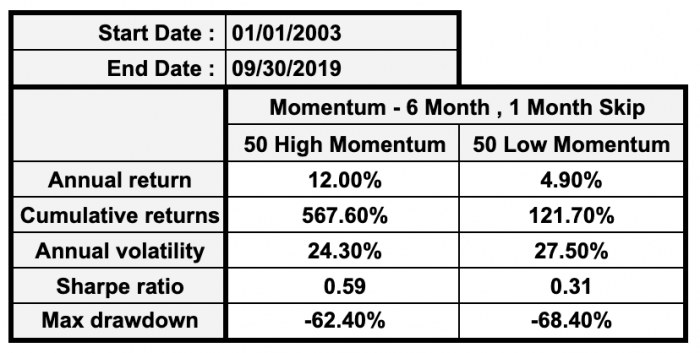
Notice that systematically investing in high momentum stocks greatly outperforms systematically investing in low momentum stocks.
- Annual returns went from 4.90% to 12.00%
- Cumulative returns for the whole time period went from 121.7% to 567.6%
- Sharpe Ratios when from 0.31 to 0.59
While the relative strength momentum edge is powerful as can clearly be seen, notice that this edge does little to nothing to control risk. Annual volatility wasn’t noticeably different between high momentum and low momentum stocks and both produced unacceptable drawdowns of over 60%.
This is one reason why combining, or stacking, many edges together is so beneficial. Combining relative strength momentum with another edge that helps control risk, such as low volatility or time-series momentum, can offer great benefits.
This is exactly what we do in our Quantamentals course. You will see that combining edges leads to greatly enhanced performance compared to each edge by itself.
Summary
In this Connors Research Trader’s Journal, we explored the relative strength momentum edge. We learned what it was, some academic evidence to support it, and finally saw its power in action.
Running a simple test comparing buying the best and worst stocks based on trailing momentum saw the stock with the best momentum produce over double the returns!
You can use this insight as a piece of your complete trading and investing models that you build in the future.
The TradingMarkets Holiday Sale Is Here!
As a Thank You for your support throughout the year, we are excited to announce our Holiday Sale.
Today through Monday, December 2, improve your trading with our most popular books, guidebooks, and courses, now on sale in our store.
Click here to visit the TradingMarkets Store today.
Larry Connors & Chris Cain, CMT