The 4 Characteristics of Strong Breakouts
Breakouts of long bases on strong volume are frequent harbingers of continued
price appreciation. Another harbinger, after the initial up-leg, is a
low-volume, orderly pullback towards support.
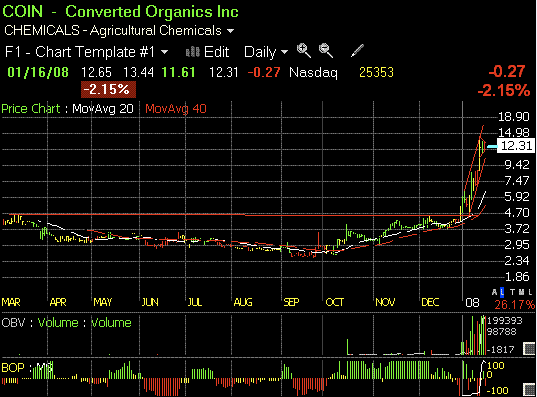
An analysis of the Converted Organics
(
COIN |
Quote |
Chart |
News |
PowerRating) chart illustrates this strategy.
As the daily chart indicates, COIN in October 2007 broke out of a base pattern
that extended back since its IPO in late February. Some traders who missed
entering early may have given up on the stock when it rose 50% from around 2 1/2
to 3 3/4, but a closer look at the chart shows why it had more room to move.
COIN’s pullbacks were orderly, coming on lower volume and holding near its
moving averages, a key sign of more upside to come. Not once did its pullback
break beneath the 40-day moving average, and most pullbacks hugged the 21-day
moving average.
The pattern was breakout (mid-October), flag, breakout (early November),
flag, breakout (late December), flag, and then breakout in mid-January, where it
closed on January 15 at 12.58, more than 5 times its pre-October breakout price.
Volume on each pullback was a small fraction of the level of the breakout, and a
shallow decline just grazing the moving averages suggested a continuation of the
uptrend.

Stock breakouts, breakout trading and using support and resistance
As a stock in a rising pattern pulls back, look for several factors to
portend the continuation of the pattern.
1. First, look for very low volume on the pullback between 10% and 25% of
the average volume of the last 90 days. Second, watch for the decline to flatten
near the 21- or 40-day moving average on the hourly charts in a quiet, narrow
flag-type formation.
2. When the breakout comes, buy on the initial thrust out of this flag
pattern. This means a sudden dramatic change in price accompanied by heavy
volume. The price doesn’t necessarily have to rise above the top of the flagpole
(i.e., the previous rally high prior to the consolidation), but only needs to be
a price bar that is at least several times the size of the previous several bars
on the chart.
3. Wait to add to the position until the stock takes out the top of the
flagpole, which is key short-term resistance. This will protect against a head
fake, which is a move that starts out dramatically but quickly fizzles price-
and volume-wise after just a bar or two and has no follow-through and, in
particular, does not make it through the top of the flagpole.
4. Set a stop below the bottom of the lowest level reached during formation
of the consolidation or flag pattern out of which it has broken. When COIN, for
example, in its November upmove exceeded the top of its October flagpole around
3.75, that was one signal to get in or add to the position. Another signal came
in the second week of January at around the 8 level, when we first highlighted
it for our subscribers.
We saw COIN having consolidated and tested its 8.70 triple-top resistance
over the previous 3-4 sessions, and noted that if it broke through that level it
could initially head to 10 1/2-11, and then beyond that to our next target of 12
1/2-13, where it last resided, as mentioned, on January 15. The COIN example
illustrates the potential that chart patterns like high-volume breakouts from
long bases and low-volume flags can have in predicting price appreciation.
Harry Boxer is an award-winning, widely syndicated technical analyst and
author of The Technical Trader, which
features a real-time diary of Harry’s minute-by-minute trades and market
insights, plus annotated technical charts & stock picks, based on Harry’s 35
years experience as a Wall Street technical analyst. You can find out more about
Harry’s work at TheTechTrader.com.
You can find more how-to and educational articles to improve your investing
and trading each day on TradingMarkets.com.
