The Benefits Of Looking At Higher Time Frames
The
opening gap up resulted in a seven-bar Trap Door short,
with the signal bar being the 10:00 a.m.
ET outside bar for both the
(
SPY |
Quote |
Chart |
News |
PowerRating) and
(
QQQ |
Quote |
Chart |
News |
PowerRating)s. It was trend down for the
rest of the day. The QQQs made a rally attempt from the 60-minute 20 EMA around
24.90, which couldn’t get past 25.07, which was right at the 15-minute 20-period
EMA. From there, the QQQs traded down to an intraday low of 24.56, closing at
24.65. The monthly pivot is 24.62. The 1.28 volatility band was 24.52 yesterday.
The intraday high for the QQQs on the signal bar high was 25.48 and +1.3% on the
day at the time. The 1.0 volatility band was 25.66, and the weekly R1 pivot was
25.56. You also had the 25.34 .38 retracement, which has been resistance for the
past 10 days. When 25.34 was reversed to the downside on the signal bar, and
then followed by a continuation entry down below the signal bar low, the game
was on.
The SPY hit an 85.78
intraday high, which was also up against the previous 85.80 high on Feb. 18.
There is now a triple top ascending triangle, with the three tops being 85.80,
85.74 and 85.78 yesterday. This triple top is also right at the .38 retracement
level to the 93.86 Jan. 13 high of 85.91. For you futures traders, the triple top
numbers for the SPX
(
$SPX.X |
Quote |
Chart |
News |
PowerRating) are 852.87, 852.28 and 852.34. The .38
retracement to 935.05 from the 806.29 low is 855.48. The SPX closed at 834.81,
and the trendline for this move from the 806.29 low is around 827, which is also
the .50 retracement to the 1982 low, so that’s a level to watch this morning. On
the upside, nothing good can happen until, for example, the SPY can re-cross its
20-day EMA around 84.90 and break above the triple top which is the 85.80 zone.
The
(
SMH |
Quote |
Chart |
News |
PowerRating)s ran to an
intraday 23.89 high yesterday, then reversed the 89-day EMA of 23.70, trading
down to an intraday low of 22.57, closing at 22.73. The upper downtrend boundary
of 23.95 proved to be enough resistance to halt that move. The SOX hit 302.06,
right into its resistance zone, and closed at 285.90. The SMHs, QQQs and SPYs
all closed in the bottom of the range on wide-range outside bars, so yesterday’s
lows become one of the key focal points both ways in today’s trading range.
With the early red in the
futures, it looks like those lows get taken out first, and maybe even on the
opening. I will look to a reversal back up above yesterday’s lows for a possible
initial long trade, and be ready to short on a second entry below yesterday’s
lows. That’s what any daytrader should be thinking pre-market today, but once
the game starts, the actual dynamics determine how you play it. You have
outlined the trading plan with the tools at your disposal, so decisions become
much easier. It’s just another trade of actual trades whose sum will end up as
positive at year’s end if you stick to some well thought out trading rules. If
you have a bad day and go net minus, you should shake it off and look at it as a
full-year business, not each individual trade.
From a position
standpoint, if you didn’t play at the .786 level for the SPX and SMHs, or the
.618 level for the QQQs, there is nothing for you to do right here. The QQQs
have already retraced .618 to that 23.32 low and rallied to yesterday’s 25.48
high, or +6.0%. On the upside, the 1,2,3 trend entry is above 25.80, which runs
into a confluence of resistance from 26 – 26.58, so that is a tougher decision.
All of the major indices are in the same situation. Yesterday was another light
volume day with news dominating, so you’ve got to expect more of that and more
volatility as we go.
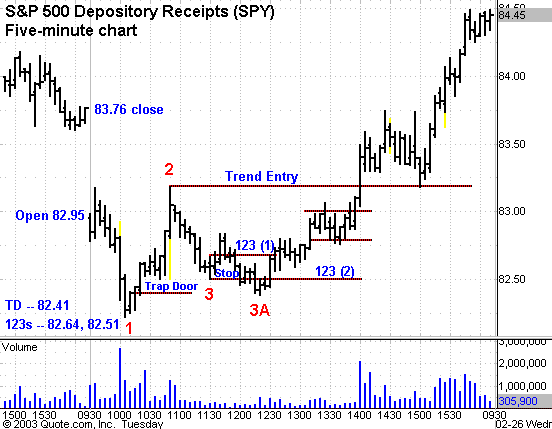
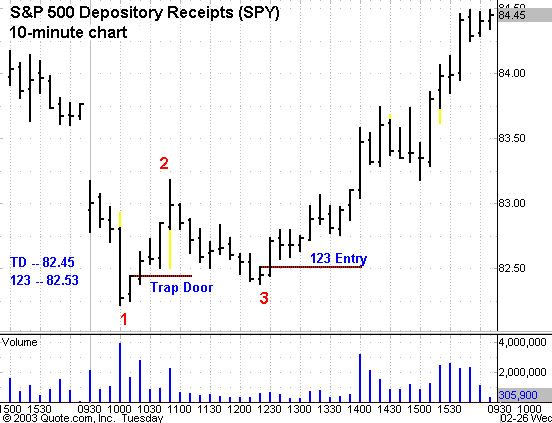
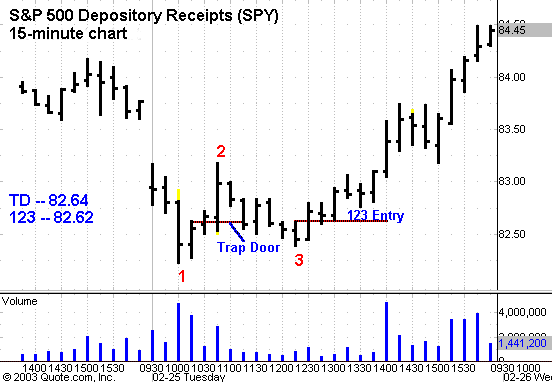
I have included in
today’s commentary an example of a Trap Door and then a subsequent 1,2,3 higher
bottom trade in the five-, 10- and 15-minute time periods on the same day. Each
chart shows you the entry levels for each time frame for both the Trap Door and
1,2,3. You will see that there was a stop out on the initial 1,2,3 on the
five-minute time frame, and then a second 1,2,3 setup for entry. Lower time
frames obviously have more noise, and therefore, you will get stopped out more
often, especially in the type of market we are in right now. By going to a
higher time frame, you give up some price, trade less, but as a newer trader,
you will probably do much better in this kind of volatility.
Have a good trading day.
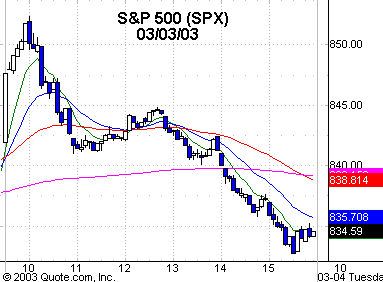
Five-minute chart of
Monday’s SPX with 8-, 20-,
60- and 260-period
EMAs
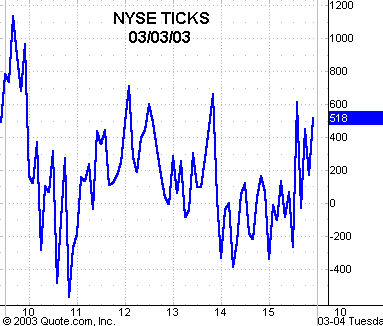
Five-minute chart of
Monday’s NYSE TICKS
