The Bernanke Devaluation SPX Election Advance
From 1990 to 1997, Kevin Haggerty served as Senior Vice President for Equity Trading at Fidelity Capital Markets, Boston, a division of Fidelity Investments. He was responsible for all U.S. institutional Listed, OTC and Option trading in addition to all major Exchange Floor Executions. For a free trial to Kevin’s Daily Trading Report, please click here.
Commentary for 2/28/12
The SPX closed at 1358.04 the day of the last commentary, 7 trading days ago, and went out yesterday on another new high rally close at 1367.59 Both the consolidated volume and NYSE volume has been extremely low during the advance, in addition to the collapse in volatility.
As expected in an election year, the Govt and media are hyping numbers that are out of touch with reality, but that doesn`t matter, because in an election year it`s what people think they are, not what they really are.
The SPX made a 1371.94 intraday high yesterday, which is +14.1% off the 1202.37 12/19/11 low in 46 TD`s as of today. There is little doubt now that this is a Bernanke rally as the angle of advance mirrors the QE 2 advance from 8/27/10 low and the Bernanke Jackson Hole QE statement. The USD made a 1/13/12 high, and the Bernake on going devaluation of the dollar has sent it trend down, while the SPX broke out at the same time above the 10/27/11 1292.66 high and took out the 1370.58 5/2/11 high yesterday on an intraday basis before closing at 1367.59.
During the current +14.% advance 32% of it was on 12/20/11 [+3.0%] the day after the 1202.37 low and the 1st day of 2012 [1/3] at +1.5% There have been only 4 days since the 12/19/11 low that the SPX has traded +1.0% or more, or +48% of the advance [+3.0, +1.5, +1.1, +1.1].
Despite the collapse in volatility the day trading has been positive, because there have been so many knee jerk news opening gaps on the NYSE, and most are followed by good contra moves, so Trap Doors and Contracted Volatility opening range setups in our focus list stocks have provided all the action you need to run your trading business.
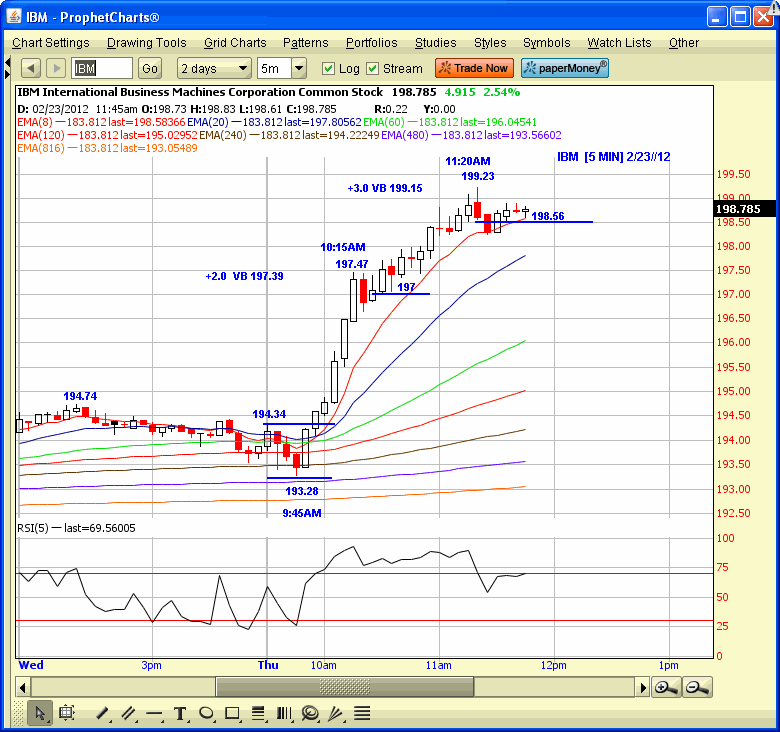
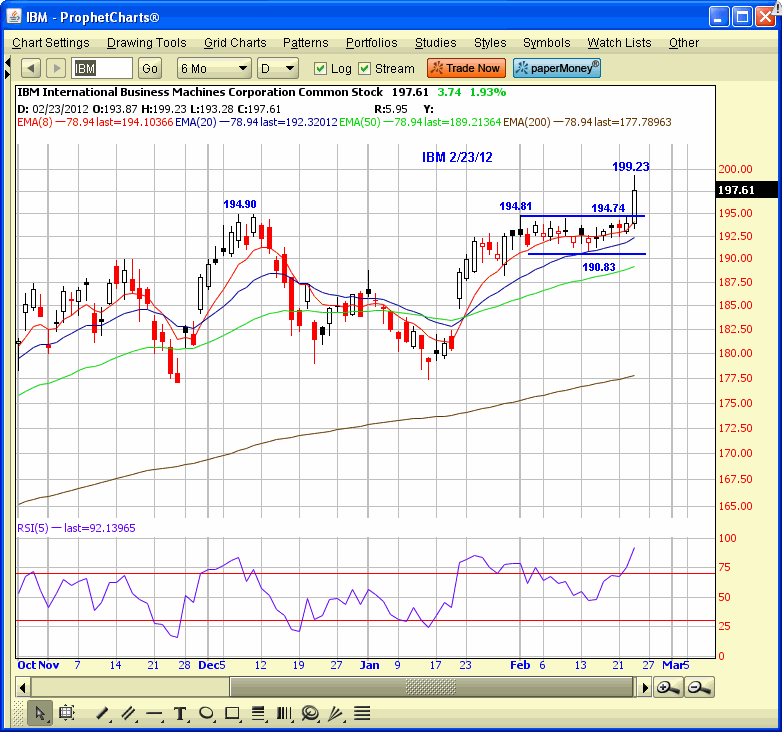
I have included the example of IBM last week where the CV pattern put you in the trade, and the bonus was the acceleration two bars after entry. As I have said in my Day Trading Courses, the “best daily chart positions usually makes the best day trades”, and that is even more true now because of Electronic Execution and High Frequency Trading, both of which accelerate the trade volatility, provided you know the basic strategies. I have also included the IBM daily chart, and that makes it obvious why the CV opening range setup was a no brainer to take.
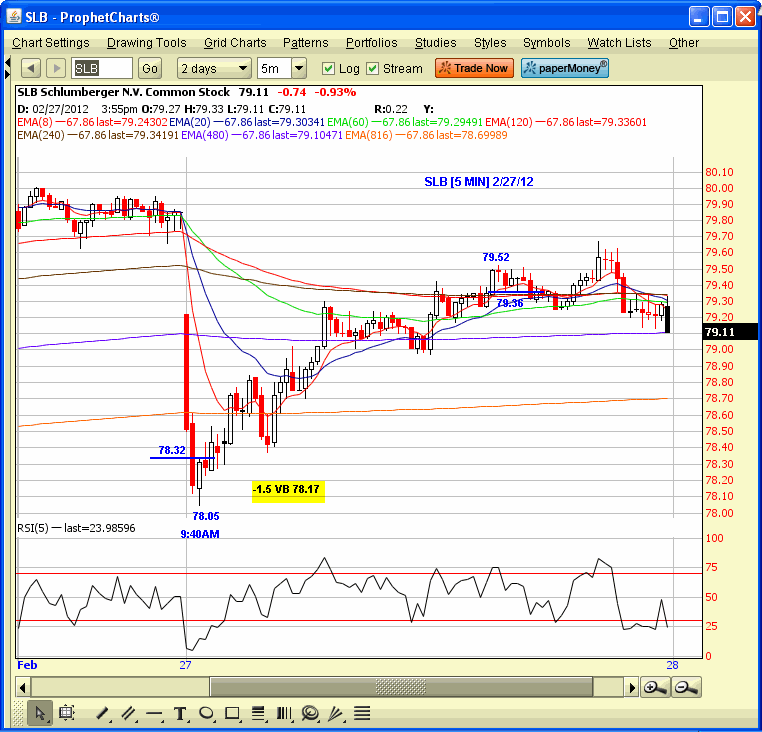
I also included a SLB Trap Door reversal trade yesterday from the -1.5 VB and a pullback to the 20DEMA which resulted from the flash downside gap opening accelerated by the electronic opening process, which is a farce, but it is “all good” for the day trading business.


Click here to find full details on Kevin’s courses including Trading with the Generals with over 20 hours of professional market strategies. And for a free trial to Kevin’s daily trading service, click here.
