The Best Way to Enter Trending Stocks
Are you a swing trader that focuses on trending stocks?Â
If so, you might spend countless hours searching through charts looking for
stocks. Here is an easy
way to combine
PowerRatings with
The
TradingMarkets Stock Scanner
to speed up the process.
How do you determine the strength of a trend?Â
The ADX (Average Directional Movement Index) helps us to
measure the strength of a trend. The ADX is measured on a scale between 0
and 100. The higher the number the
stronger the strength of a trend. Readings above 40 indicate a strong
trend. Note that ADXÂ is not used to determine the
particular direction whether up or down.Â
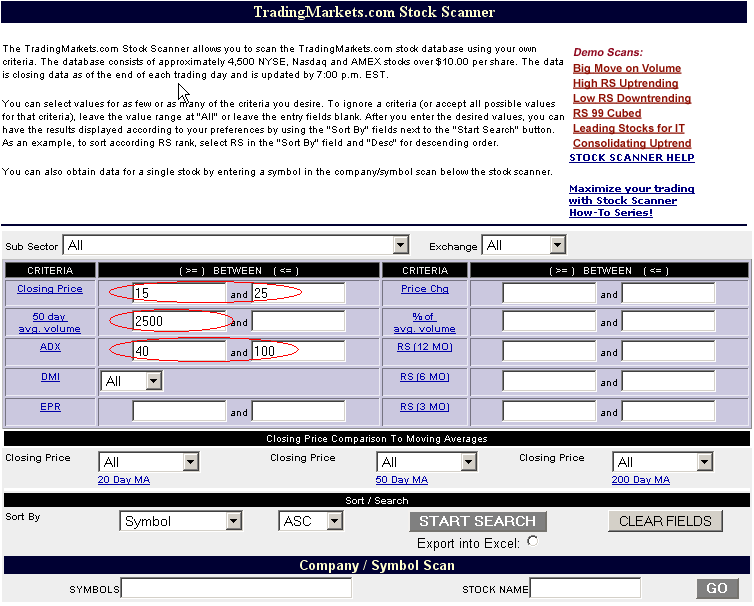
Here is a one of my favorite daily scans to find trending
stocks to trade:
1. Stock price between $15 and $25.
2. I look for stocks that
have a good degree of liquidity, so that entries and exits can be made more
easily. Therefore, I inserted 2500 into the 50-day average volume box (The
volumes are in 100’s, so inputting 2500 means you are looking for volume above
250,000 shares traded per day).Â
3. ADX between 40 and 100.
The inputs should look like this:
Here is a list of results:

We can then check each resulting stock’s
PowerRatings. The stocks rated 7 or higher would be put on your watch
list and for the more aggressive trader stocks rated 3 or lower should be
included on the watch list as well.
From 1995-2005,
stocks with a PowerRating of 8 have outperformed the S&P 500
index on average by an 8.3-to-1 margin, while a PowerRating of 10 doubles that
performance to 16.3.
PowerRatings also help indicate a stock’s
downside as well as timely short-sale entry points; PowerRatings of 1 and 2 have
on average lost money over the next week. A PowerRating of 1 typically
underperformed the S&P 500 by a 5-1 margin. Obviously, you should ideally be
looking to buy high PowerRating stocks and avoid (or short) low PowerRatings
stocks.
Reminder: We are in no way recommending the purchase or short sale of these
stocks. This article is intended for education purposes only. Trading should be based on your own understanding of market conditions,
price patterns and risk; our information is designed to contribute to your
understanding. Controlling risk through the use of protective stops is critical.
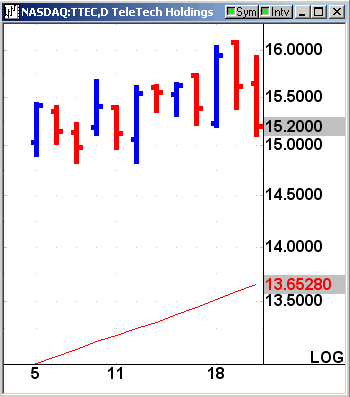
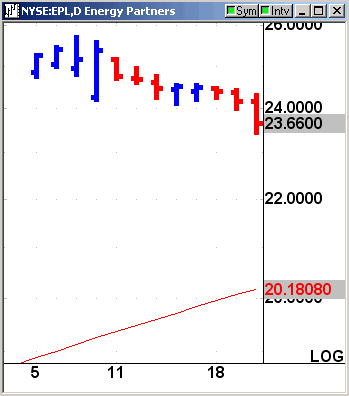
Here are a few daily charts from stocks rated 7 or
higher:
TeleTech Holdings
(
TTEC |
Quote |
Chart |
News |
PowerRating)
Energy Partners
(
EPL |
Quote |
Chart |
News |
PowerRating)
Â
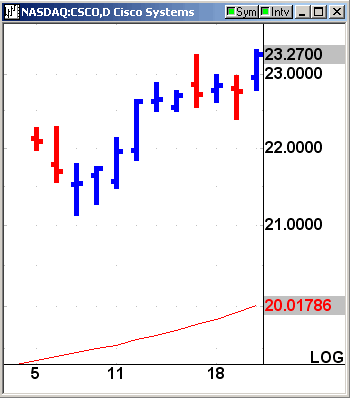
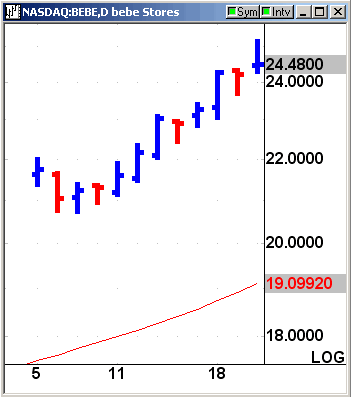
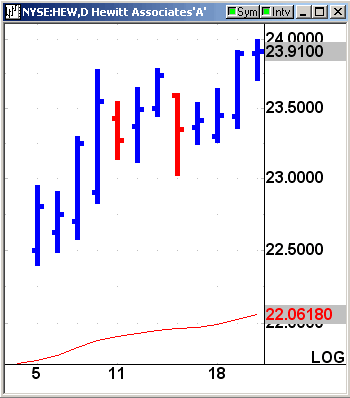
Here are a few daily charts from stocks rated 3 or
lower:
Cisco Systems
(
CSCO |
Quote |
Chart |
News |
PowerRating)
BEBE Stores
(
BEBE |
Quote |
Chart |
News |
PowerRating)
Hewitt Associates
(
HEW |
Quote |
Chart |
News |
PowerRating)
Â
You can
attend a free
class on how to use
PowerRatings,
presented by Steve Primo, our Director of Education.
Click here to
try
PowerRatings for yourself, risk free.
Darren Wong
Associate Editor
Want a free month of PowerRatings?
Send us your PowerRatings
strategy and receive one free month of this exciting trading tool. If you are
already a monthly or annual PowerRatings
subscriber, you will receive an additional three months if we publish your
strategy.
Reminder: We are in no way recommending the purchase or short sale of these
stocks. This article is intended for education purposes only. Trading should be based on your own understanding of market conditions,
price patterns and risk; our information is designed to contribute to your
understanding. Controlling risk through the use of protective stops is critical.
