The BP Bounce
Monday in
this column, we highlighted the likelihood for a tradable bounce out of a Fibonacci
zone. If you recall, the zone was unique in that it was made up of Fibonacci
extension levels of 1.272 and 1.618 from multiple low to high swings. Well…two
days later BP is ramping hard out of this Fibonacci price support zone. In fact,
below is a daily chart of BP, and if you follow candlestick patterns, BP put in
a beautiful bullish candlestick pattern against my price support zone which was
a great confirmation for our trade.
At this point
BP has a couple of resistance zones that it will face to move higher. Those come
in at: 38.30 – 38.95 (4 levels). Note that at 38.95 we fill the gap from a
couple of weeks ago. The next Fibonacci price decision zone comes in from 40.32
to 40.94 on this daily chart. The “easy” money has been made on the initial
bounce. Now we have to work at it. Personally, I’m taking partial profits at
these levels and moving my stop to breakeven.

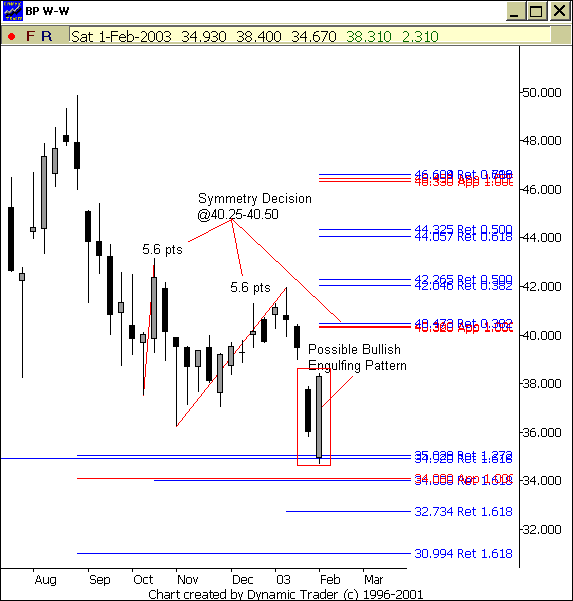
Now, when we
shift back to the weekly chart where the set up occurred, you can see that if
we can hold our gains through week end, we’ll have a bullish engulfing pattern
on our hands which is a great signal for longs. On this chart, the main item
that jumps out at me is the symmetry of the previous two rallies. Each rally
was 5.6 points. After those rallies BP rolled over. If we rally 5.6 points from
the current swing low that would make the focus resistance decision come in
around 40.25-40.50.

On a side note,
thanks for all the great feedback on the Triple Crown module. We recently highlighted
Apollo Group (APOL) as a bullish Triple Crown set up in the nightly Stock & ETF Report. In the chart below, you
can see it made a straight line down to the “Zone,” paused for a couple days
and has been rocketing up for a few days now. The risk/reward on these setups
are very nice.

Have a great
night!
