The current market action is important
The short-term activity of the S&P
and major indices may yield important clues as to future action here.
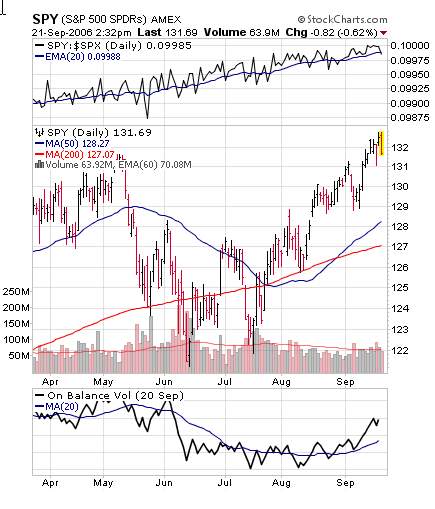
The major indexes are testing May’s highs — and how they behave on this test is
important. The S&P is into a Fibonacci time frame and a Fibonacci retracement
level and is testing key resistance at May’s highs and is having a bit of a
reaction. A key question is whether it is tracing out an ascending triangle or a
wedge. A strong and high volume close over 133-34 next week will be bullish and
suggest further upside to around the 137 level. Conversely a decline from here
below the trend line drawn up from the July lows to September lows, meaning a
close below around the 130.5 level, would complete a wedge and suggest a sharp
retest of July’s lows. Therefore how the market reacts from here could be
critical to its next short-term direction.
While the big-cap indexes have been making a good show, the
majority of smaller and mid-cap stocks have been lagging badly. Chart 2 below,
which shows the small cap growth i-share illustrates this point clearly. The
S&P large cap index fell in May from around 132 to 121 and has come all the way
back to the 132 level. Contrast this with the action of the small cap growth i-share
which fell from around 81 to 67 and is now reacting back down off of 74, the 50%
retracement level and also 200 ma resistance. Many indexes are approaching
resistance levels here. Despite the divergence, note that IWO is also at a
critical resistance level of 50% and 200 ma, and that a breakdown below the up
trend line drawn from the August lows to September lows following a failed test
of the 200 ma would not be positive action.

One of our favorite trades since May has been large caps
over small caps, and the above two charts illustrate how much stronger large
caps have been since then. We have also emphasized the importance of the
breakdown in commodities and metals over the last few weeks. The large-cap
market in particular has gotten some wind in its sails by the drop in crude
oil. We wonder though whether the declining growth that is likely behind the
steep drop in crude will not eventually impact earnings enough to spook even the
big cap indexes for a spell as the slowdown develops.
Short-term traders should watch the wedge versus ascending
triangle result carefully here and go with the direction the market clearly
indicates via a number of indexes in this regard. A bullish resolution could be
used to trade some of the stronger sectors on the long side such as
pharmaceuticals, insurance, and software. Conversely, a bearish resolution of
the wedge formation in a number of indexes should send traders to the sidelines
or betting with
(
SDS |
Quote |
Chart |
News |
PowerRating) or other inverse iShares on at least a short-term
correction.

Certainly we stand ready to go with the up move in big caps
IF breadth and internal strength picks up. But so far that is not happening
with enough plurality to force a suggestion of strong allocation. Internal
breadth is improving some, but is still below levels normally associated with a
sustainable bull market move. We continue to rate the macro environment as not
highly reliable (except perhaps for bonds and
(
TLT |
Quote |
Chart |
News |
PowerRating), which are likely to beat cash
as the US slows down and have broken out of a base recently).
Investors should continue to skeptically let market
action be the guide. Strong rallies in the major averages accompanied by high
volume to create a couple more follow-through days would be the first sign of
more upside ahead. The real excitement may not come until the breadth of Top RS
new highs starts to expand broadly and stocks meeting our runaway up fuel
criteria begin to break out with some plurality. Until then, we still suggest
keeping your powder mostly dry. We continue to suspect that making new highs
will be difficult for the market to do unless better volume and breadth
materializes. We will slightly adjust this view if the market can break out on
good volume next week. Nonetheless for investors, we continue to regard
this as a TREACHEROUS ENVIRONMENT where CAPITAL PRESERVATION SHOULD BE
PARAMOUNT. Don’t allocate heavily to anything that doesn’t scream at you.
Lots of bonds and cash
seem prudent here until the environment becomes clearer. Long/short pairs can
be sparingly participated in as well.

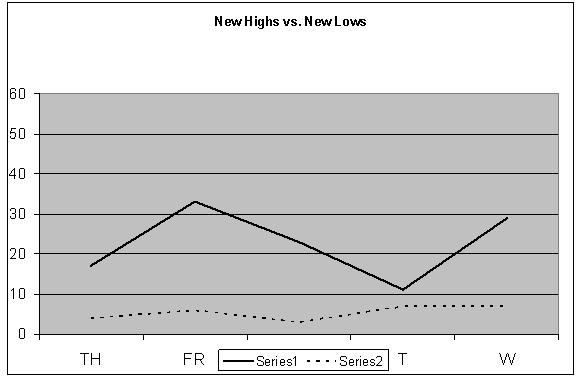
US selection methods, our Top RS/EPS New Highs list published on
TradingMarkets.com, had readings of 17, 33, 23, 11 and 29 with 10 breakouts of
4+ week ranges, 1 valid trades meeting criteria
(
TWGP |
Quote |
Chart |
News |
PowerRating), and no
close calls. This week, our bottom RS/EPS New Lows recorded readings of 4, 6,
3, 7 and 7 with 3 breakdowns of 4+ week ranges, no valid trades and no close
calls. The “model†portfolio of trades meeting criteria has some time back
exited all positions and is heavily in cash.
Mark Boucher has been ranked #1 by Nelson’s World’s Best Money Managers for
his 5-year compounded annual rate of return of 26.6%.
For those not familiar with our long/short strategies, we suggest you review my
book "The Hedge Fund Edge", my course “The
Science of Trading“, my video seminar, where I discuss many new techniques,
and my latest educational product, the
interactive training module. Basically, we have rigorous criteria for
potential long stocks that we call “up-fuel”, as well as rigorous criteria for
potential short stocks that we call “down-fuel". His website is
www.midasresourcegroup.com.
