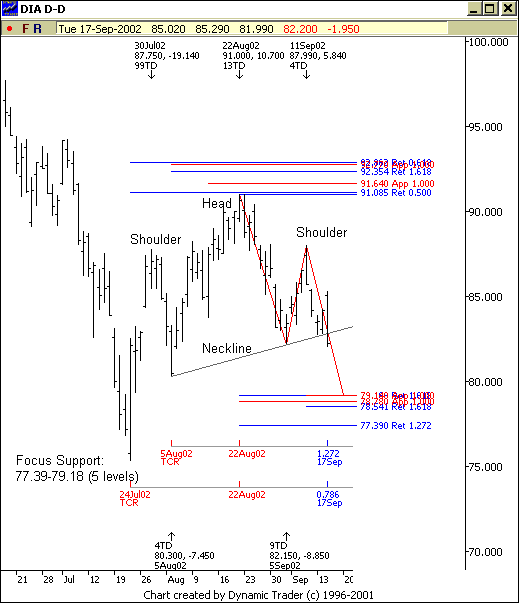
The Diamonds’ Neckline
The daily chart of the Dow
Diamonds
(
DIA |
Quote |
Chart |
News |
PowerRating) is just oozing with information right now. In fact, if this plays
out the way the charts are setting up, the market activity should be very exciting
over the next few days. I’m getting ahead of myself. Let me bullet point this:
- The daily chart has formed
a Head-and-Shoulders Pattern against our price resistance zone. The neckline
of this formation was broken today. This would call for a sizeable selloff
over the next few trading sessions (could be one session for that matter).
- This Head-And-Shoulders
pattern may pull a lot of weak hands out of the market, creating a downdraft.
However, the other side of this story is that we have a very solid Fibonacci
price support zone from 77.39 – 79.18. This support zone is further solidified
by the fact that if DIA continues to sell, this ETF will form a two-step pattern
into our Fibonacci support zone. On top of that, I also have two Fibonacci
time cycles pointing to a possible cycle low in the next day or so.
So, what exactly does all
this mean? The short of it is this: This market has set up to sell off (and
could do it in dramatic fashion) over the next couple of days. The Dow Jones
could drop another 200-300 points quickly. However, if this plays out based
on how the charts are set up, this index will likely find support between 7700
– 7900
based on our Fibonacci pattern, price support and time cycles.
How to trade it? Well, some
may short this ETF down into the support zone from 77.39 – 79.18. Others may wait
until DIA hits support and look for opportunities to go long with an initial
stop just below the Fibonacci support zone. Regardless, we have key parameters
to make decisions against.

Good night!
