The end of this month could mark the start of something good
Market
Review:
This week in
the stock indexes posted one of the smallest value area ranges we’ve seen in
years… ranks right up with or past the last two weeks in June and December
2005. For all the media hoopla about how indexes are up big for the year, we
inside the game know that most upward progress came in a few brief surges, with
hours of sideways agony surrounding them.
Does that malaise leave any
potential for the intraday emini trader during normal pit-session hours?
S&P 500 sold off a slight bit on Thursday, predictable to a fault. We
expected Friday’s opening swing(s) to be lower as the missed-out gang from
yesterday scramble aboard today, fully explained in the pre-market post
here Friday morning.
Our
expectations turned to fruition. Price action came right up and tapped layers of
resistance points right near the daily pivot. Perfect… short the index
at/below 1294 highs. That play was profiled in our trade room, and worked
successfully down to 1290.00 for something inside +4pts profit potential. Not a
big move, but this week was nothing but a small sideways range for the S&P from
start to finish.

Lo & behold, the “dipsters” saw that early test of Thursday lows and bought the
dip. Also as expected and predicted in the room. Guess where price action went
next? Right back up to the daily pivot and at least two different key measures
of resistance meshed together.
When the
first completed bar failed to break out, next one opened was a confirmed sell
signal. This swing dropped from 1294 to 1288.50 lows for potential profits
somewhere inside +5pts on the return.

Once that double top = lower low sequence played out, Fib grid traders were
searching for clusters all over the place as usual. We know that group is
gunning for various levels, good information to have. It just so happened that
ES 1291 was a cluster point of various different tech analysis resistance
points… and a high-odds place to short again.
Result
was low of the day to 1287.75 for a scalper’s potential gain of +3pts or so.
Intraday trade chart signals remained 100% bearish. Once that third try short
failed to gain any downside traction towards the close, fold up shop and call it
a day.
Three
trades, +12pts ES potential in a sloppy, choppy day. Total range of merely 7pts
from high to low make this another micro-range session within a micro-range
week.

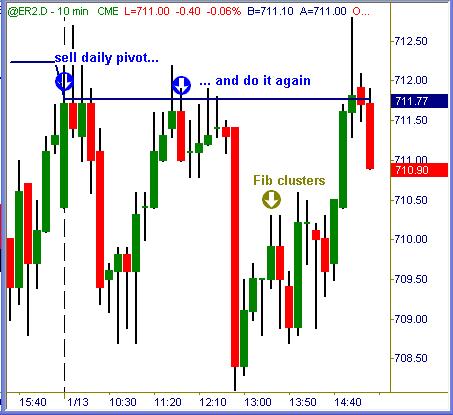
Russell 2000 was more erratic today than ES, as it usually is in these
trendless, sideways sessions. We’re used to that by now. However, it did clearly
offer short trade signals at the pivot along with ES and we clearly acted on
those setups accordingly. Later on, same Fib cluster = convergence of many tech
tools near 710+ offered a third sell signal that worked for scalper’s gains at
best.
Total of
at least +2pts, +3pts and +1pt profit potential on three defined swings were
available. Again the overall structure of this chart is sideways chop and
nothing else. Knowing how to play the game in these comatose markets only hones
our skills for when normal market action blessedly returns for good.
Summation
On a personal basis, I strongly dislike trading current stock index
conditions. These are hands down the toughest intraday market tapes I’ve ever
seen, and I’ve seen nearly all of them in the S&Ps since late 1999. If you can
make it here, you will make it anywhere in the future. If you struggle to make
it here in these dead-range sessions, better periods of trading certainly lie
ahead.
We can
only take what the market has to offer within our chosen symbols and approach.
Right now the intraday ranges and swings are microscopic. Swing traders who
bought the market early last week are or were up nicely, but the very moment
they cover those trades, opportunity ceases to exist for new swing trades right
now.
I would
opine that the start of earnings season and arrival of Greenspan’s final FOMC
event to end this month could spark the start of a stock market swing. I also
think it will be factor(s) yet unknown to the markets that spur 2006’s biggest
move.
It is
basic human nature to expect present conditions to project far into the future
regardless of what the topic is. As for financial markets, NDX players once
thought that index would ramp to the sky. USD players recently thought that the
greenback would reach parity with the peso.
Not too
long ago, scrap metal dealers paid $60 per ton for short steel and $1 per pound
for scrap copper. Friends of mine in the collection business once had trouble
keeping inflow steady. Checked those prices in the business section of your
paper lately? Now every hunk of old metal that sits idle is a candidate for cash
to pay off massive credit card debt.
Historical examples of change go on and on. Humans though stone wheels, wooden
ships, horse carriages and steam power would last forever. So did buyers of
$2,000 Dell computers that are now a mere shell of today’s $399 version. So too
will VIX and VXO levels at 11 for the first time since 1996. For now we play the
hands that are dealt us, with clear understanding that new dealers with shuffled
decks will soon take over the table.
Trade To Win
Austin P
(Weekend Outlook trend-view section…
open access each Saturday evening)
Austin Passamonte is a full-time
professional trader who specializes in E-mini stock index futures, equity
options and commodity markets.
Mr. Passamonte’s trading approach uses proprietary chart patterns found on an
intraday basis. Austin trades privately in the Finger Lakes region of New York.