‘The Game’
The
reflex rally for the major indices lasted a day
before a news-initiated fear day greased the slide. Triple M
(
MMM |
Quote |
Chart |
News |
PowerRating), down
just over 6 points, was the obvious point drag on the Dow
(
$INDU |
Quote |
Chart |
News |
PowerRating) which
was off 212 points, or -2.4%, closing at 9712.27. This puts it at the bottom of
its two-month trading range, but below all of its moving averages. The semi
fallout from Intel’s
(
INTC |
Quote |
Chart |
News |
PowerRating) cutting of expenditures and forecasted lower
sales hit equipment stocks hard, such as
(
KLAC |
Quote |
Chart |
News |
PowerRating), -9.5%, and
(
AMD |
Quote |
Chart |
News |
PowerRating),
-8.9%. Teradyne
(
TER |
Quote |
Chart |
News |
PowerRating) led the semis on the downside at -14%.
The SPX
(
$SPX.X |
Quote |
Chart |
News |
PowerRating)
after having made a 1 2 3 higher top, which was also an RST top at the 1174
resistance zone, is also trading below all of its moving averages. Unless the
SPX,
(
$NDX.X |
Quote |
Chart |
News |
PowerRating) and
(
$DJX.X |
Quote |
Chart |
News |
PowerRating) can rally above their recent resistant
highs, the test of the September lows is in progress. The
NDX diverged from the SPX and DJX, which had both put in 1 2 3 higher tops,
while the NDX gave us a 1 2 3 lower top. The last swing-point low support for
the NDX is 1557. The index closed at 1558.98, or -3.3%.
NYSE volume expanded
yesterday to 1.5 billion, with a volume ratio of just 18, with 1.2 billion on
the downside. Breadth was negative at -879. The
(
QQQ |
Quote |
Chart |
News |
PowerRating) volume was the most
this year at 91 million. The fact that option expiration is this Friday
certainly contributed to the NYSE volume increase, as most of what has to get
done is usually prior to expiration Friday.
Yesterday’s decline took
the weekly advance/decline and volume ratios to the top of their oversold
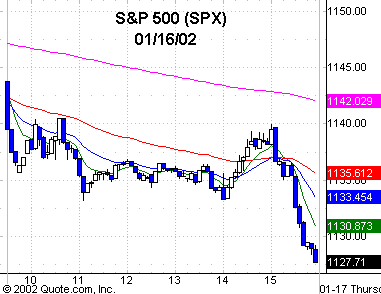
levels. The SPX closed at 1127.57, or -2.0% on the day, and with the short-term
oversold condition, I was hoping for an early downdraft this morning in the SPX
taking it to the .24 retracement zone to the September low of 1121. For your
trading plan, the other Fib retracement levels are .38 (1089), .50 (1061), .618
(1034) and .786 (995). The minor Fib at .707 is 1013.
When I left last night at
6:00 p.m., the QQQs had rallied from a 38.78 close to 39.12. I didn’t bother to
look at what earnings news flash generated the move because the reaction will be
traded, not the news. Just as we got Trap Doors and volatility band trades
yesterday from the downside emotion, I would look to do the same on any
emotional retracement to the upside with stops close to the entry point. That is
the best risk/reward scenario you have.
From what I see on the
screen at 7:00 a.m., with the S&Ps +7 points and the Nasdaq +20, the SPX
won’t see the 1121 level on the opening 15-minute time slot. However, we do know
that funny money can change on a dime.
Stocks
Today
Today’s focus starts on
the intraday charts, certainly with the semis that had air pockets like
(
KLAC |
Quote |
Chart |
News |
PowerRating),
(
AMAT |
Quote |
Chart |
News |
PowerRating) and
(
NVLS |
Quote |
Chart |
News |
PowerRating), which all traded 100% more than their
average volume. You also had others, such as
(
GNSS |
Quote |
Chart |
News |
PowerRating),
(
MXIM |
Quote |
Chart |
News |
PowerRating) and
(
TER |
Quote |
Chart |
News |
PowerRating), just to name a few. You get the drift, looking for oversold reflex
longs on intraday charts and depending on how the day develops, retracement
shorts.
In spite of the big down,
there are a few stocks that set up on your daily charts. They are
(
GILD |
Quote |
Chart |
News |
PowerRating),
(
MEDQ |
Quote |
Chart |
News |
PowerRating),
(
TGT |
Quote |
Chart |
News |
PowerRating),
(
STJ |
Quote |
Chart |
News |
PowerRating),
(
BRKS |
Quote |
Chart |
News |
PowerRating) on a recross of the 20,
(
NVDA |
Quote |
Chart |
News |
PowerRating),
(
AFFX |
Quote |
Chart |
News |
PowerRating) and
(
UTSI |
Quote |
Chart |
News |
PowerRating) on a recross of the 50.
On the shortside because
of the nature of the volatility with option expirations and the earnings news,
I’d stay with the proxies for all the major indices and the sectors.
Have a good trading day,
and as I look, I see the S&Ps have moved up to +8 and the Nasdaqs are +24.

Five-minute chart of
Wednesday’s SPX with 8-, 20-,
60- and 260-period
EMAs

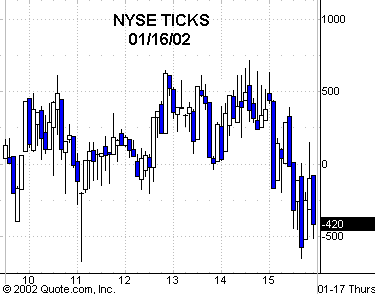
Five-minute chart of
Wednesday’s NYSE TICKS
|
Additional
Below are the tools that Kevin uses on the TradingMarkets
|
