The Game Is On
The S&P 500
(
SPX |
Quote |
Chart |
News |
PowerRating) after an excellent
move off the 1081 bottom (which was within 23 points of the exact .786
retracement between the ’98 low of 923 and the 3/00 high of 1553) we entered the
earnings/warnings season in an overbought condition and the game is on again. The S&P 500
has had five lows in succession from the key resistance zone — which you were
well aware of in advance. Why should that surprise you? Markets advance, then
they pull back, and vice versa.Â
The Fallen Angels led us
out with
(
SUNW |
Quote |
Chart |
News |
PowerRating) once again saying it was going to miss fourth-quarter expectations and
then big volume blew it down with the same increased volume gapping
(
EMC |
Quote |
Chart |
News |
PowerRating)
down. The downgrades, as always, followed declining price as Morgan Stanley
downgraded the Fiber Optics. This followed Morgan Stanley’s analyst saying he
had “cautions” on
(
JNPR |
Quote |
Chart |
News |
PowerRating) but of course had none at all when JNPR
was trading in the 200s. Please, save us from this white-collar crime syndicate
called Wall Street research.
To keep it in perspective,
I like to keep a running chart of the SPX with a 5% filter which blocks out much
of the daily noise and program trading which, for your information, has reached
the highest percentage (25%-33%) that I can remember. A quick example is from
the 1081 low, the SPX advanced 9.4% in four days, then declined 7.7% to 1092 in
five days as it tested the 1081 low which set up the 1,2,3 bottom. From 1092,
the index advanced 20.5% — without a 5% or more retracement — to the key
retracement zone, and peaked at 1316.Â
This was a 32-day move
without at least a 5% retracement. The total move to date is +21.7% in 42 days
from the 1081 low. Yesterday, the SPX closed at 1248, a decline of 5.1% in five
days, which is the first decline of 5% or more since the 1092 low. Even without
the earnings circus, you should expect that — and more — to shake out the
short-term overbought condition. The emotions turn to greed after the big up and
normal logic goes out the windows. That’s what makes markets.
The SPX has retraced back
into the previous trading range, with the bottom of the range at 1232 — which
becomes inflection point to be aware of. The Fib retracements on the way down
are: .38 at 1227; .50 at 1200 (which is also where the gap is so there is a
magnet zone); and then the .618 at 1170. The Nasdaq 100
(
NDX |
Quote |
Chart |
News |
PowerRating) retracements now in play are the .50 at 1711 and the .618 at 1626. The
bottom of the previous range number to be aware of is 1743.45. Yesterday,
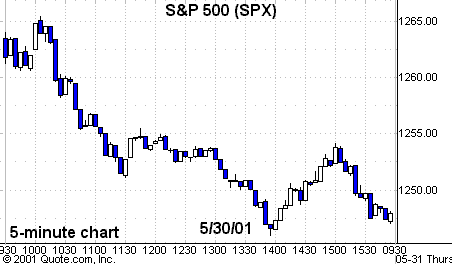
after declining all morning, the SPX rallied just 8 points off the 2.0
Volatility Band zone. The low was 1245.96 vs. the 2.0 band at 1243. It ran to
1254 before fading into the 1248 close. The NDX had a 33 point rally off its 2.0
band level and also faded to close at 1779.Â
As I mentioned in prior
text, we are in the key zone for profit moves which is the last two days of the
month, and first five days of the new month. As I look at the screen, the
S&Ps are up 5 points and the NDX futures +13. You know the 1232 and 1743
bottom-of-range numbers in case they head fake it, taking out those lows, then
reversing them to the upside. I have mentioned before that the highest
probability is a Fib retracement from this advance and I still think so, even if
we do pop from the short-term overbought condition.
Stocks
Today
|
(June
|
||
|
Fair Value
|
Buy
|
Sell
|
|
1.65
|
 2.75 |
 0.45
|
In spite of the down day,
there were many more long setups than the previous day as stocks pull back to
their bases and get some nibbling.Â
Stocks are:
(
BMET |
Quote |
Chart |
News |
PowerRating),
(
FISV |
Quote |
Chart |
News |
PowerRating),
(
NVDA |
Quote |
Chart |
News |
PowerRating) (on a recross of the 20-day
EMA of 86.54),
(
APC |
Quote |
Chart |
News |
PowerRating),
(
CVS |
Quote |
Chart |
News |
PowerRating),
(
GD |
Quote |
Chart |
News |
PowerRating),
(
CB |
Quote |
Chart |
News |
PowerRating),
(
FLR |
Quote |
Chart |
News |
PowerRating),
(
FDC |
Quote |
Chart |
News |
PowerRating),
(
UNH |
Quote |
Chart |
News |
PowerRating),
(
HCA |
Quote |
Chart |
News |
PowerRating),
(
BAX |
Quote |
Chart |
News |
PowerRating) and
(
TYC |
Quote |
Chart |
News |
PowerRating).Â
In the Travel Range stocks
look closely for intraday setups in
(
VRSN |
Quote |
Chart |
News |
PowerRating) and
(
VRTS |
Quote |
Chart |
News |
PowerRating).
Have a good trading day.

Five-minute chart of yesterday’s S&P 500 (SPX) with 8-,
20-, 60-
and 260-EMAs

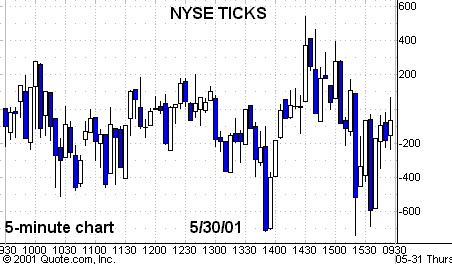
Five-minute chart of yesterday’s NYSE Ticks
