The Generals’ Deal
A
bigger percentage downside in price for
the major indexes, but with below-average volume which we have seen in both
directions. The NYSE traded 90% of its average volume at 982 million, a volume
ratio of 28 and negative breadth at -641. The Nasdaq was even lighter at 80% of
its average volume, trading 1.4 billion with negative breadth at -966. The
(
SPX |
Quote |
Chart |
News |
PowerRating)
closed at 1161.51, down 1.5%, and the NDX 100
(
NDX |
Quote |
Chart |
News |
PowerRating) at 1526.29, or
-3.3%.Â
There are a couple of
retracement attempts that aborted. The dynamics were weak all day, as the
up-volume to down-volume ratio couldn’t get over .5 after 10:00 a.m. The only
sector green after 10:30 was the utilities, which is the
(
UTY |
Quote |
Chart |
News |
PowerRating). The
(
SOX |
Quote |
Chart |
News |
PowerRating),
(
BKX |
Quote |
Chart |
News |
PowerRating) and
(
XBD |
Quote |
Chart |
News |
PowerRating) were only green until just before 10:00 a.m. The point
is beware of the dynamics with any contratrend intraday trades.
In yesterday’s text, I
said the semis could retrace half of the recent rally. The
(
SMH |
Quote |
Chart |
News |
PowerRating), which
halted right at the 100-day EMA, ran from 42 to 47.68 and closed yesterday at
45.66. The 50-day EMA is 45.20, the .50 retracement is 44.84 and then the .618
retracement at 44.16. This is certainly an alert zone to see if the buyers
return.Â
Framing the NDX this
morning, I see that the NDX 100 closed right on its .786 retracement to the Aug. 23
1497 low. It has a closing range of approximately 10 points, 1536-1526. It has
the minor resistance at 1540-1545 from yesterday’s sideways range after the
early down. You now move to the Aug. 22 1468 low, framing it to the 1602 Aug. 27
high. The .618 retracement zone is 1519, and the .786 zone is 1496, and that’s
the one with the highest probability.
The reason I say that is because there is
confluence with the first leg down from 1602-1538, then there was a rally to
1560, and we’re now in the process of a second leg down, or if you like,
“C” of an ABC correction. The second leg equals the first leg at 1496,
so it now gets my attention. This is a zone, not an absolute number as so many
of you new subscribers seem to think. You need a reversal entry pattern around
the zone before you take entry. It’s how you use the tool that sets you apart,
not the tool itself. This 1496 zone is also in-sync with parallel lines, which
along with Fibonacci, has been written about long before any of us were born,
even me. The question is will it or won’t it? And the answer is who knows? But
we are ready to get on the train, not debate it.
|
(September
|
||
|
Fair Value
|
Buy
|
Sell
|
|
1.85
|
3.10
|
0.70
|
Stocks
Today
In the semis, remain
focused for any kind of pullbacks or return of the Generals in
(
KLAC |
Quote |
Chart |
News |
PowerRating),
(
NVLS |
Quote |
Chart |
News |
PowerRating),
(
LRCX |
Quote |
Chart |
News |
PowerRating),
(
MCHP |
Quote |
Chart |
News |
PowerRating),
(
RFMD |
Quote |
Chart |
News |
PowerRating),
(
NVDA |
Quote |
Chart |
News |
PowerRating) and
(
ELNT |
Quote |
Chart |
News |
PowerRating). These are
all above their 50- and 200-day EMAs. Also keep
(
MU |
Quote |
Chart |
News |
PowerRating) and
(
TXN |
Quote |
Chart |
News |
PowerRating) on your
screen.
On the short side if we
go red, look at
(
DAL |
Quote |
Chart |
News |
PowerRating),
(
BA |
Quote |
Chart |
News |
PowerRating),
(
FBF |
Quote |
Chart |
News |
PowerRating) again today,
(
BSC |
Quote |
Chart |
News |
PowerRating),
(
MWD |
Quote |
Chart |
News |
PowerRating),
(
TVN |
Quote |
Chart |
News |
PowerRating),
(
MERQ |
Quote |
Chart |
News |
PowerRating),
(
GILD |
Quote |
Chart |
News |
PowerRating),
(
XLNX |
Quote |
Chart |
News |
PowerRating),
(
HGSI |
Quote |
Chart |
News |
PowerRating) and also the
(
BBH |
Quote |
Chart |
News |
PowerRating)s.Â
And also, I apologize if
any of you tried to reach me by e-mail. My e-mail has been down since late
Friday, so I haven’t ignored you, I just haven’t gotten any. Good old DSL
again.Â
And also as I look at the
screen, I see the early red has turned to minor early green.
Have a good trading day.

Five-minute chart of
Wednesday’s SPX with 8-, 20-,
60- and 260-period
EMAs
Five-minute chart of
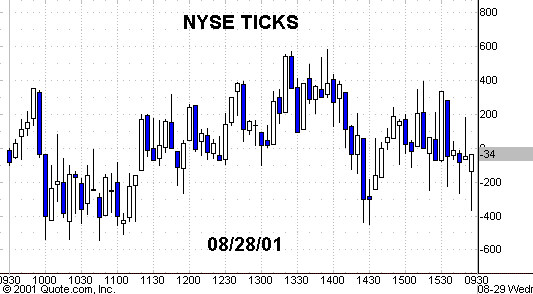
Wednesday’s NYSE TICKS
Do you have a
follow-up question about something in this column or other questions about
trading stocks, futures, options or funds? Let our expert contributors provide
answers in the TradingMarkets Trading Advisor! E-mail your question to questions@tradingmarkets.com.
For the latest answers to subscriber questions, check out the Q&A section,
linked at the bottom-right section of the TradingMarkets.com home page.