The Generals’ weightings always tell a story…
Kevin Haggerty is the former head of trading for
Fidelity Capital Markets. His column is intended for more advanced traders. If
you would like to learn how Kevin trades,
you can find more information here.
The major indices opened up and stayed that way
with no trading retracement to take advantage of. Wednesday’s SPX
(
SPX |
Quote |
Chart |
News |
PowerRating)
1237.06 and
(
SPY |
Quote |
Chart |
News |
PowerRating) 124.13 highs were taken out by the 11:20 a.m. ET bar as
the SPX traded up to 1243.13, closing at 1241.48, +0.8%, as did the Dow to
10,679. After taking out the 124.13 high, the SPY traded to the 08/03/05 124.74
rally magnet high and backed off to close at 124.60, +0.9%. The SPY was +3.6%
off the 08/29 120.39 low going into month-end, September new money and Katrina
stabilization. The 5 RSI has gone from 20 to 75 on this rally from the .382
retracement zone to 113.55 and .618 retracement to 118.26. The SPX/SPY, unlike
the Dow, has remained an "Above the Line" condition since 05/24/05 during the
19-day retracement to the 89-day EMA zone led mostly by the energy, healthcare
and semiconductors stocks. The
(
DIA |
Quote |
Chart |
News |
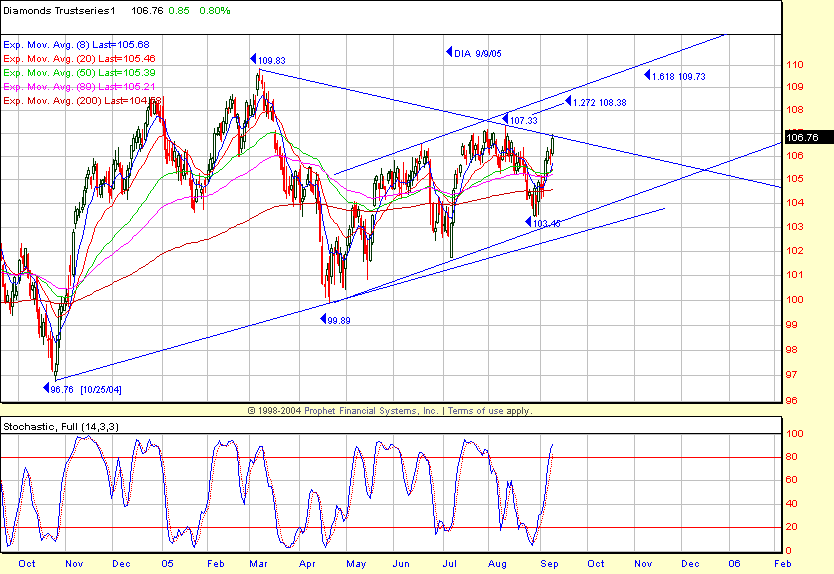
PowerRating) is pushing the symmetrical triangle
trendline from 109.83, which is at 107, with the last swing point high at
107.33. If they push this eight-day-old rally, the 108.38 and 109.73 Fib
extensions are in play, along with, of course, the 109.83 high (see charts).
The sectors outperforming the SPX on Friday were
gold, with the XAU +2.6%, HUI, +2.4%, HGX, +2.0%, XLU, +1.2%, and the XLB,
+1.1%. The XLB still remains in a range and below its 28.20 200-day EMA, closing
Friday at 28. The
(
TLT |
Quote |
Chart |
News |
PowerRating) was +0.3%. The red sectors were the $TRAN, -0.8%,
and
(
SMH |
Quote |
Chart |
News |
PowerRating), -0.6%, led by
(
INTC |
Quote |
Chart |
News |
PowerRating), -3.2% on some negative hype which
often leads to a contra reflex move after a few days, just like the major
indices these days — "Bad is good, good is bad." The Generals have clearly
increased their weighting to the defensive sectors as the XLV made new all-time
highs and closed last week at 32.41. The XLU (utilities) continue their new-high
advance with a 33.43 close. The XLP (consumer staples) closed at 23.36 with a
symmetrical triangle continuation breakout ready above 23.50 and new rally highs
above 23.80. Energy continues to new highs, with the XLE closing Friday at 52.80
and having no retracement since the "Generals’ Pullback" to the 40-week EMA in
May. Financials have ranged out since December 2003 with the XLF trading between
26.54 – 30.79, closing Friday at 29.87. The XLB continues to underperform and
trade in a range below its 40-week EMA of 28.21, closing Friday at 28. Things
will get weaker on a downside break below 26.70. The same is true for the XLI
below 28.80. The Dow is in an uptrend since April 2005, but remains below its
downward channel line from the 109.83 high that will be resolved soon one way or
the other. This is a significant divergence at this point. The SMH has made a
+38% move low-to-high off the April 2005 27.70 low and has stalled the past nine
weeks between a 38.30 high and 36.03 low. The retracement zones to the 45.54
January 2004 high are 39.78 (.618RT) and 38.05 (.50RT).
The SPX had retraced four weeks with lower lows
and highs from its previous 1245.86 rally high, so the reversal above the
previous week’s 1227.29 high on Friday brought technical money off the bench,
and the SPX traded up to 1243.13, closing the week at 1241.48 with the 5-, 15-
and 40-week moving average situation remaining "Above the Line." The resistance
following the 1245.86 SPX takeout is where the game plays out, and not where you
commit longside money.
Have a good trading day,
Kevin Haggerty

