The good thing about yesterday’s market
Stocks attempted to follow through on
the previous day’s gains Thursday morning, but extensive overhead
resistance caused the major indices to reverse at mid-day and close with losses.
The Nasdaq Composite
(
COMP |
Quote |
Chart |
News |
PowerRating), up 0.8% at its intraday high, finished 0.5%
lower. The small-cap Russell 2000
(
RUT |
Quote |
Chart |
News |
PowerRating) and mid-cap S&P 400 indices followed
a similar pattern, as both indices saw their earlier 0.7% gains evaporate and
change to 0.4% losses. Relative strength in the blue chips enabled the Dow Jones
Industrials
(
DJX |
Quote |
Chart |
News |
PowerRating) to retain a 0.2% gain, but the S&P 500
(
SPX |
Quote |
Chart |
News |
PowerRating) lost
0.2%. All the major indices except the Dow closed at their intraday lows,
hinting at potential weakness into today’s open.
Turnover rose across the board yesterday, indicating another
day of institutional selling. Total volume in the Nasdaq increased by 5%, while
volume in the NYSE was 4% higher than the previous day’s level. The losses on
higher volume caused the Nasdaq to register its fifth “distribution day” within
the past four weeks. For the S&P, it was the sixth such day of institutional
selling within the same period. Although the Dow closed marginally higher, its
intraday action was bearish and marked by selling into strength. When the S&P
had its fifth “distribution day” on February 7, it should have served as a major
warning sign to the bulls. However, many traders and investors ignored the
importance of institutional volume patterns and bought stocks on February 8.
Institutions subsequently took advantage of that bounce and sold into strength
yesterday afternoon, thereby causing the formation of another “distribution
day.” Astute traders know the value of analyzing the broad market’s price and
volume patterns on a daily basis, which is why we do it as well.
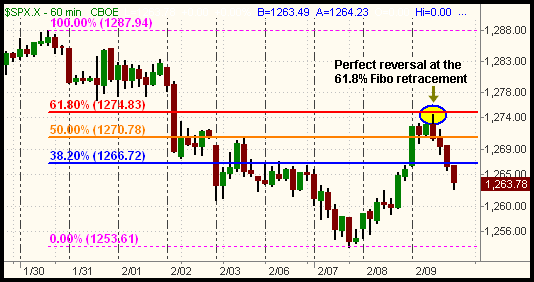
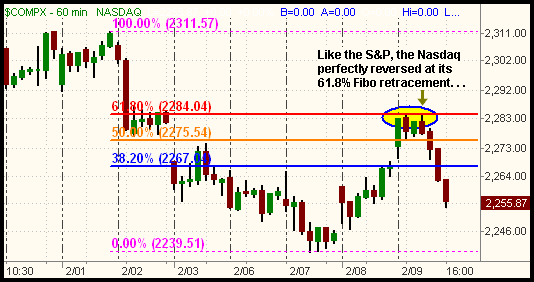
As you may recall, we viewed the February 8 rally as merely a
bounce into resistance that provided a short-selling opportunity as opposed to a
time to buy stocks. We illustrated how the 20-day moving averages had perfectly
converged with the 61.8% Fibonacci retracement levels in both the S&P and Nasdaq,
the combination of which we anticipated would provide major resistance. With
textbook accuracy, those levels perfectly marked yesterday’s highs and triggered
the mid-day reversals in both the S&P and Nasdaq. The hourly charts of both the
S&P and Nasdaq below illustrate this:


The good thing about yesterday’s action is that it makes it
easy to define our new short-term resistance levels in the broad market. Simply
put, yesterday’s highs in each of the major indices should not be violated now.
If they are, then caution on the short side is necessary. A break above
yesterday’s highs would represent a recovery back above the 20 and 50-day MAs in
both the S&P and Nasdaq, which could gather upside momentum due to short
covering. But as long as we stay below those highs, our bias remains firmly on
the short side. Further, both the small and mid-cap indices are now poised to
break support of their uptrend lines as well.
As for support levels, the next major area of support for both
the S&P and Nasdaq is their December lows. On the S&P 500, that low is around
the 1,245 level. On the Nasdaq, the 2,200 level is a major area of support. As
we approach those levels, we will look to tighten stops on all remaining broad
market short positions.
Due to continued relative weakness in the mid-cap stocks, we
simultaneously covered our short position in SPY (S&P 500) and shorted
(
MDY |
Quote |
Chart |
News |
PowerRating)
(S&P 400 Index) yesterday afternoon instead. So far, this is working well
because MDY subsequently dropped 0.2% more than SPY into yesterday’s close.
Assuming the overall broad market weakness continues, we expect small and
mid-cap stocks to lead the way lower, just as they led the market higher for so
many months. We also remain short both
(
OIH |
Quote |
Chart |
News |
PowerRating) (Oil Service HOLDR) and
(
XLU |
Quote |
Chart |
News |
PowerRating)
(Utilities SPDR), the former of which is now showing nearly a 9-point marked to
market gain and nearing our profit target.
Open ETF positions:
Short OIH, MDY, and XLU (regular subscribers to
The Wagner Daily
receive detailed stop and target prices on open positions and detailed setup
information on new ETF trade entry prices. Intraday e-mail alerts are also sent
as needed.)
Deron Wagner is the head trader of Morpheus Capital Hedge Fund and founder of
Morpheus Trading Group (morpheustrading.com),
which he launched in 2001. Wagner appears on his best-selling video, Sector
Trading Strategies (Marketplace Books, June 2002), and is co-author of both The
Long-Term Day Trader (Career Press, April 2000) and The After-Hours Trader
(McGraw Hill, August 2000). Past television appearances include CNBC, ABC, and
Yahoo! FinanceVision. He is also a frequent guest speaker at various trading and
financial conferences around the world. For a free trial to the full version of
The Wagner Daily or to learn about Deron’s other services, visit
morpheustrading.com or send an e-mail to
deron@morpheustrading.com .
Â
Â
Â
