The High Waves
If you are familiar with
candlestick charting, you have probably heard or read about
"high waves." The high waves pattern is often observed near the
important highs, such as a two-month high and a 52-week high. This pattern
consists of a series of candlesticks with long upper shadows. This pattern can
be also identified easily on a regular bar chart because you will find more than
a few bars with tails near the level of the important high.
As you may have guessed already, this pattern is a bearish signal. An upper tail
is evidence of failed rallies. One tail is already a sign of weakness, but more
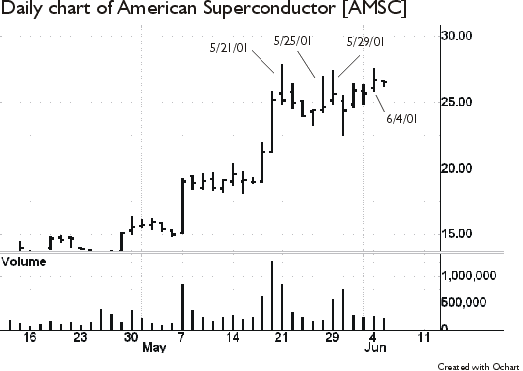
than a few are definitely troublesome. The chart below is a daily chart of
American Superconductor Corp. (AMSC).
As you can see, the first tail was formed at a two-month high on May 21, then
the second on May 25, the third on May 29, and the fourth on June 4. Obviously,
the high of the May 21 bar has become a resistance level.
Watch out for too many tails.