The Key Levels To Watch For Friday’s Market
Stock
index futures opened Thursday’s session under pressure, despite the Bank of
England cutting its benchmark rate for the first time in a few years, and
injecting more cheap money into the system. The selling was light off the open,
but the absence of any real buying squelched any attempt to fill the gap. The
selling dried up quickly, though, as the SPoos found support at the 10-day MA,
like we’ve seen numerous times lately. A slow recovery back into the opening
range smelled like timid bottom-pickers and led to a nice and orderly sell-off
to new session lows. The knife-catchers had their stops hit as the selling
accelerated, before basing out into a range going into the lunchtime lull. A
few afternoon attempts to move out simply ran out of steam, rather than running
into any heavy selling. Breadth started out the session pretty horrid and
really never recovered the entire day.
The
September SP 500 futures closed out Thursday’s session with a loss of —9.75Â
points, while the Dow futures posted a same relative loss of —93 points.Â
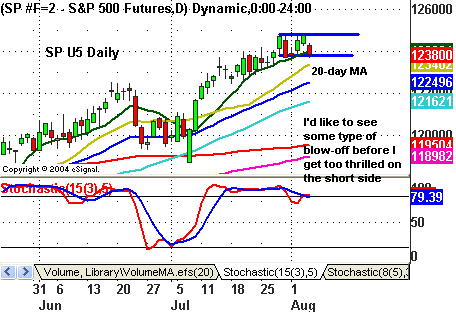
Looking at the daily charts, the ES posted a market structure high and settled
below its 10-day MA for the first time since 7/7, leaving next good support at
its 20-day MA at 1234. The YM a market structure high and bearish engulfing
line and cracked both its 10-day and 20-day MAs in 1 shot. Despite the
weakness, both contracts are merely testing the lower end of their recent
trading ranges. On an intraday basis, the 60-min bullish Gartley patterns are
looking more like inverted cup and handles, especially with the break of the
channel and bear flag handles that formed. For you daily 3-Line Break
followers, the ES barely remains long with a Break Price of 1237, while the YM
remains long with a Break Price of 10598.
 Â Â Â Â Â Â Â Â Â
        Â
Friday
morning at 8:30 ET gives us the big economic news of the week with the July jobs
numbers. Non-farm payrolls are expected to post a slightly higher increase than
June of 183,000 new jobs, while the Unemployment Rate is expected to remain
steady at 5.0%. Up until now, the market really hadn’t offered anything real
concrete in the way of a pullback and even Thursday’s retracement was pretty
shallow. So, that leaves the big question, which should be answered on Friday,
as to whether we’re seeing another correction through time, rather than price,
or just a shake out of weak hands ahead of Friday’s data. The closing Put/Call
ratio and VIX extension have me leaning to the former for Friday.
Â
Â
Daily Pivot Points for 8-5-05
| Symbol | Pivot | Â Â Â Â Â R1 | R2 | R3 | S1 | S2 | S3 |
| INDU | 10637.88 | 10669.10 | 10728.09 | 10759.31 | 10578.89 | 10547.67 | 10488.68 |
| SPX | 1238.27 | 1241.39 | 1246.92 | 1250.04 | 1232.74 | 1229.62 | 1224.09 |
| ES U5 | 1241.00 | 1245.50 | 1253.00 | 1257.50 | 1233.50 | 1229.00 | 1221.50 |
| SP U5 | 1239.57 | 1242.43 | 1246.87 | 1249.73 | 1235.13 | 1232.27 | 1227.83 |
| YM U5 | 10646.00 | 10686.00 | 10752.00 | 10792.00 | 10580.00 | 10540.00 | 10474.00 |
| BKX | 100.12 | 100.46 | 100.97 | 101.31 | 99.61 | 99.27 | 98.76 |
| SOX | 476.36 | 480.23 | 487.91 | 491.78 | 468.68 | 464.81 | 457.13 |
Â
Weekly Pivot Points for Week of 8-1-05
| Symbol | Pivot | Â Â Â Â Â R1 | R2 | R3 | S1 | S2 | S3 |
| INDU | 10666.52 | 10692.12 | 10743.34 | 10768.94 | 10615.30 | 10589.70 | 10538.48 |
| SPX | 1235.83 | 1243.50 | 1252.83 | 1260.50 | 1226.50 | 1218.83 | 1209.50 |
| ES M5 | 1238.67 | 1246.83 | 1256.92 | 1265.08 | 1228.58 | 1220.42 | 1210.33 |
| SP M5 | 1238.53 | 1246.27 | 1255.73 | 1263.47 | 1229.07 | 1221.33 | 1211.87 |
| YM M5 | 10663.67 | 10748.33 | 10819.67 | 10904.33 | 10592.33 | 10507.67 | 10436.33 |
| BKX | 100.48 | 101.13 | 102.37 | 103.02 | 99.24 | 98.59 | 97.35 |
| SOX | 472.73 | 479.53 | 484.62 | 491.42 | 467.64 | 460.84 | 455.75 |
Â
Please feel free to email me with any questions
you might have, and have a great trading week!
Chris Curran
Chris Curran started his trading career at the
age of 22 with a national brokerage firm. He combines fundamentals and
technicals to get the big picture on the market. Chris has been trading for 15
years, starting full time in 1997, and has never had a losing year as a
full-time trader.
Â
