The Key Time Factors for This Market
Kevin Haggerty is a
full-time professional trader who was head of trading for Fidelity Capital
Markets for seven years. Would you like Kevin to alert you of opportunities in
stocks, the SPYs, QQQQs (and more) for the next day’s trading?
Click here for a free one-week trial to Kevin Haggerty’s Professional
Trading Service or call 888-484-8220 ext. 1.
The Q2 markup by the Generals was weak, although they were able to lift the
SPX off the Wednesday 1484.18 low, and close the week at 1503.35 (+.06%) or just
.79 points above the previous week’s 1503.56 close. The seasonality extends for
the first few days of July, and is also bolstered by the July 4 holiday bias,
but the end of Q2 was also the 6-month performance report card, and the market
action was disappointing, especially coming off the 1538.71 high on 6/15. Friday
was an erratic last day of Q2, and also included the rebalancing programs. The
SPX opened strong and traded to 1517.53 on the 10 AM bar (+12 points) and +1.0
Volatility Band at 1516.78. It was also an RST sell pattern. The SPX went
trend-down (-24 points) to 1493.61, with the -1.0 Volatility Band at 1494.61. It
reversed from that zone +10 points to 1503.86 before closing at 1503.35. The
extent of the contra move from the 1517.53 high was unexpected on the last day
of Q2, but the +10 point gain in the last half hour got the SPX to close Q2
above 1500.
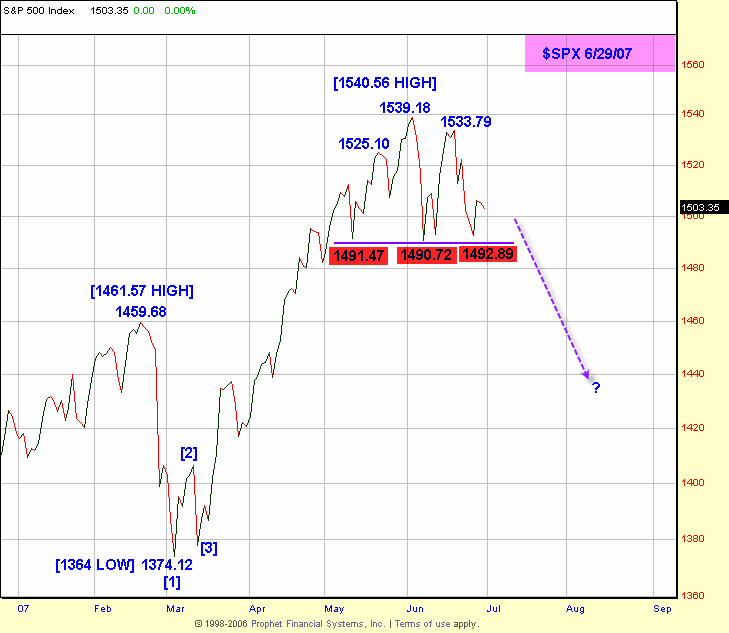
There is a significant triple-bottom (closing basis) pattern for the SPX with
the 3 low closes at 1491.47, 1490.72 and 1492.89. After/or if there is a holiday
bounce, this is the obvious downside focus for the start any extended
retracement to the 1364 low (3/14/07), which was a -8.1% decline from the
1461.57 high (2/22/07). This is also a key time period which includes Gann
trading day counts on 7/2 (from 2/20/07), 7/10 (from 3/14/06). It also has a key
anniversary date of 7/8/32 all-time low. The week ending 7/6 has Gann symmetry
with the week ending 3/14/06, which was the Wave 2 (789) retracement to the
10/2/02 769 SPX bear market low.
The universe of stocks that has pushed the SPX higher has obviously narrowed,
as it normally does in the last phase of the bull market, but it is never
positive when the brokerage stocks start to unravel, which we are seeing now.
Forgetting about BSC and the sub-prime problem, there is MER, which is now
trading below its 200-day ema, from a 1-2-3 lower top, closing Friday at 83.58,
and the NYX (NYSE) at 73.62, down -34% from the 11/22/06 111.62 high. The MER
high was 98.68, then declined to 76.85, before the lower top rally to 95 on
5/21/07. LEH traded below its 200-day ema of 74.55 on Friday before closing at
75.80. The energy sector has been the leader in the SPX rally off the 1364 low,
and crude oil ($WTIC) closed above 70 on Friday to 70.68, so if this sector
remains strong, it is obviously a positive. The TLT broke below that 86.60 head
and shoulder neckline with a price objective of 81.40 and came close to that the
1st time, at 82.20 (6/12/07) before the current 13-day rally to the 85.17 close
on Friday. At the same time, the $US Dollar declined from 83.27 to 81.92. The
subprime situation will mostly spread despite what the Federal Reserve says. It
is never just the initial problem that ends the crisis.
By historical measurements back to 1950, this current bull market is now the
longest period between bull market tops, and is also the 2nd longest period
between 4-year cycle lows since the 1898 days from the 8/9/82-10/20/87 bottoms.
The price pattern of this current bull cycle also resembles 1987 on the final
run-up to a top. As of Friday, it was 1723 calendar days from 10/10/02, and it
will become the longest period on 12/22/07, when it is 1899 days. Time is more
important than price in measuring the market, and by that measure, the
risk/reward of being fully invested and un-hedged in this current market makes
little sense based on the time factor. The coming 2008 Presidential election
will be a war, and the Republicans must keep the economy moving forward, if even
at the slow pace it is now, and avoid any significant decline in the equity
market. If the Fed can engineer a 1994-type soft landing, maybe they can keep
any selloff to the -10% zone, but the odds never favor that soft landing
scenario. The PPT (Plunge Protection Team) is probably warming up in the bullpen
right now.
Liquidity will be thin at times this holiday week, so daytraders should
manage trades accordingly by taking partial profits, which makes it emotion-free
to manage the balance, when your stop is moved to break even or higher. It is
usually better to concentrate on the major indexes and ETFs during this kind of
holiday week.
Have a good trading day,
Kevin Haggerty
Check out Kevin’s strategies and more in the
1st Hour Reversals Module,
Sequence Trading Module,
Trading With The Generals 2004 and the
1-2-3 Trading Module.

