The Key Zone Trade
From 1990 to 1997, Kevin Haggerty served as Senior Vice President for Equity Trading at Fidelity Capital Markets, Boston, a division of Fidelity Investments. He was responsible for all U.S. institutional Listed, OTC and Option trading in addition to all major Exchange Floor Executions. For a free trial to Kevin’s Daily Trading Report, please click here.
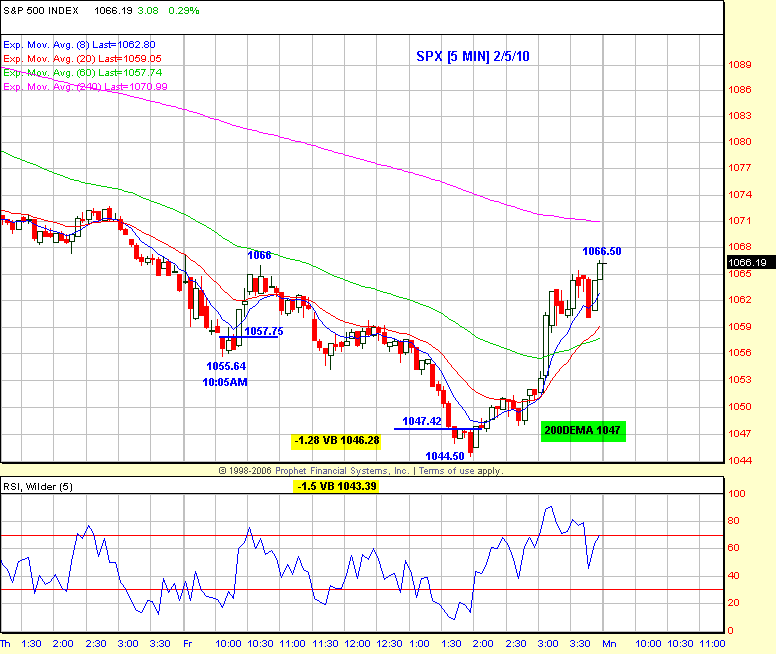
The SPX made a 1044.50 intraday low Friday, which is a -9.2% decline from the 1150.45 cycle high, and closed at 1066.19 after another one of those “mystery moves” in the last 2 hours. It hit 1071.20 yesterday, and then faded to close at 1056.74 giving back over half of the rally from 1044.50.
The decline to 1044.50 hit the anticipated key price and time zone, so day traders caught the rally into the 1066.19 close, and those day traders that also swing trade carried the trade over with a nice profit cushion.
The price symmetry for the zone on Friday was the 200DEMA and 65WK EMA at 1047, 40WK EMA at 1046, 233DEMA 1044, and 12 Month EMA at 1042. Also, 1043 is the .382RT to the 869.32 low (7/8) from the 1150.45 cycle high, and is also a key Angle level measured from 1150.45.
There was also significant time symmetry from 2/4-2/8 (+/- 2 days) measured from the 3/6/09 667 low, which is only outlined for Trading Service members. However, there was also some significant Fibonacci time symmetry, which is something you should be aware of at all times when you are identifying high probability reversal zones, both major and minor.
The Fib ratio time symmetry in this case was the 3.1416 (Pi) Fib extension ratio of the 21 days between the 10/2/09 and 11/2/09 SPX lows, which is 66 days. The 1044.50 low on 2/5 was day 65 (+/- 2 days timing factor) Also, it was day 13 down from the 1150.45 high. I have included the SPX 5 min chart from Friday which shows the “no brainer” entry at the 200DEMA.
I always anticipate these key price and time zones in advance, because when the market nears these potential turning points, we must look to other technical evidence to see if a reversal is indeed warranted, and in this case the market was extended beyond the 3 month -2.0 STDV level so, the trade was warranted.
The next commentary is Thursday 2/11.
Have a good trading day!
Click here to find full details on Kevin’s courses including Trading with the Generals with over 20 hours of professional market strategies. And for a free trial to Kevin’s daily trading service, click here.

