The Last Good Trade: Radio Shack
This week’s TradingMarkets Last Good Trade is another example of how our very basic approach to Swing Trading can help traders make gains in the stocks that are making the headlines–before those stocks are making the headlines. Yesterday’s case of Radio Shack
(
RSH |
Quote |
Chart |
News |
PowerRating), which disappointed traders with news of slumping wireless subscriptions sales, was another example of how sound swing trading techniques can help put traders in the proper position to take advantage of big moves in stocks–before those big moves happen.
We did not take this trade (click here for a look at the trades we have been taking recently in our TradingMarkets Battle Plan for Stocks daily, pre-market subscription service). But the trading approach of buying low and selling high that we use every day is just as applicable to the stocks making headlines as they are to the stock we ferret out every day for our subscribers.
We like to sell overbought stocks that are trading below their 200-day moving averages. Our research, involving millions of short term stock trades, supports this idea of betting against weak stocks rather than pursuing “value” by buying stocks that are under that 200-day moving average threshold–especially in the short term.
Once we’re under the 200-day moving average, we use the 2-period Relative Strength Index (RSI) to spot truly overbought markets. While many traders prefer the 14-day RSI, we have found a much better edge in the short term with a shorter RSI of only two periods. We also raise the bar when it comes to a stock being overbought. For many traders, a stock that has an RSI of 70 is overbought. For us, we need an RSI of 90–minimum.
In the second half of April, Radio Shack was trading under its 200-day moving average. By April 21st, the stock had rallied from an intraday low just south of 15 to a closing high of $16.70. And as of that close, Radio Shack’s 2-period RSI registered an above-90, 91.57.
This would put a stock like Radio Shack on our short watch list: trading under its 200-day moving average, with a 2-period RSI of more than 90. But what would it take for us to pull the trigger on such a trade?
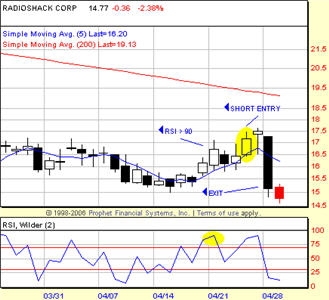
In the same way that we prefer to buy intraday weakness, we also like to sell short on intraday strength. When betting against stocks, we want to get short anywhere from 2-6% above the close. So given RSH’s April 21st close of 16.70, would be looking to short the stock at anywhere between 17.03 and 17.70.
Radio Shack reached an intraday high of 17.46 just a few days later on the 24th.
Once in, how do we get out? We like a dynamic exit, using a close beyond the 5-day moving average, to ensure that we are always exiting long positions on strength and short positions on weakness. Again, we are always, always looking to buy weakness and sell strength. This is true whether we are entering long and looking to exit as the stock was showing strength or, as would be the case with a stock like Radio Shack: entering short and exiting as the stock was showing weakness.
On Monday, that show of weakness arrived. As news of Radio Shack’s inability to increase its wireless plan subscription base penetrated the market, traders began selling the stock and driving it dramatically lower over the course of the trading day. By the end of trading, RSH had closed beyond its 5-day moving average, triggering an exit as the stock ended the day at $15.13, more than two points lower than the stock was just two days ago when the stock made its critical intraday high.
Again, we didn’t take this trade. And we are not saying that every trader who uses our approach to buying low and selling high will make 2 points in 2 days with every trade. But what we can offer is a quantified, model-driven approach to short term trading that has produced upwards of 70% winners in simulated stock trades since 1995 (more than 60% winners for short trades).
If your short term, stock trading could use a tune up, consider taking out a free trial to our TradingMarkets Battle Plan for Stocks. Every morning before the market opens, we’ll provide you with 3-5 trade opportunities to the long side, potential short trades when available, as well as notes on overbought and oversold exchange-traded funds (ETFs) and critical short- and intermediate term market timing analysis for traders of the e-mini, SPY or SPX options.
Click here to start your free trial to the TradingMarkets Battle Plan for Stocks–or call us at 888-484-8220 extension 1 today.
David Penn is Senior Editor at TradingMarkets.com.