The Low Down on Lower Lows
A stock goes lower. And lower. And lower. And lower. Are you ready to buy it yet?
If that stock is a strong stock, trading above its 200-day moving average, then there’s a pretty good chance that your answer should be “Yes!”
Everybody knows that the key to short term trading is to buy low and sell high. Sure, some traders prefer to buy high and sell higher. But the idea that you want to buy a stock when its price is lower than you think it will be in short order is the same.
So why don’t more traders look to buy stocks that have experienced multiple consecutive lower lows? Why do so many traders look at such stocks as “bearish” instead of “bullish”?
Surely it can’t be for lack of information. After all, we offered Larry Connors’ most recent book, How Markets Really Work as a free download last week and nearly 4,000 traders downloaded their copy. How Markets Really Work, among other things, helps explain why traders should be looking to buy stocks that have experienced multiple lower lows instead of looking to sell them.
As we summarized in an article last year, our research into short term stock price behavior revealed that stocks that had five or more consecutive lower lows actually outperformed stocks that had five or more consecutive higher highs. This was true in one-day, two-day and one-week timeframes.
Higher highs are the signature of an uptrending stock. Nothing makes a trader more bullish than seeing a series of higher highs. But the evidence, in stock trade after stock trade between 1995 and 2007 clearly indicated that such bullishness was largely unwarranted. Traders would have done better to buy lower lows than buy higher highs over the past twelve years.
Click here to read our research into stocks that have experienced five or more consecutive lower lows.
Much of this is at least partially commonsensical. After so much selling, bargain hunters are likely to emerge. And because we believe only in buying stocks that are above the 200-day moving average, these stocks that have experienced multiple lower lows are more likely the victims of profit-taking than the true loathing that occurs with weak stocks, stocks that are trading below the 200-day moving average.
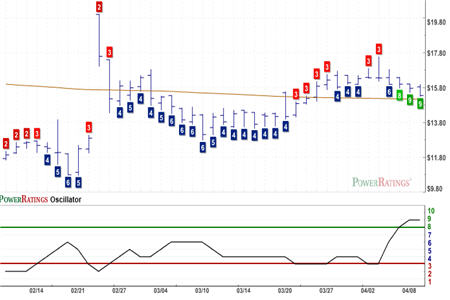
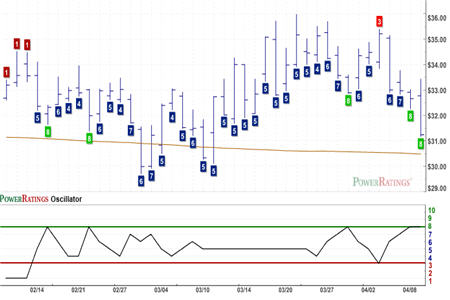
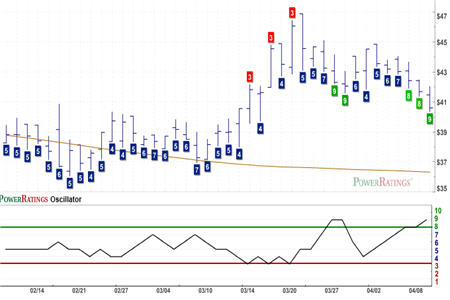
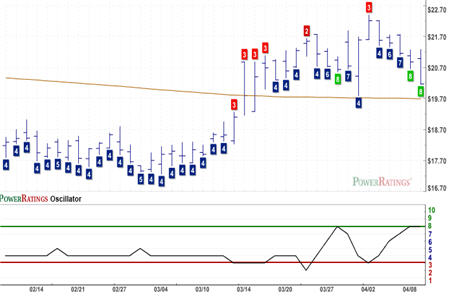
All four stocks in today’s report have experienced five or more consecutive lower lows. They also have Short Term PowerRatings of 8 or 9. Our research indicates that stocks with Short Term PowerRatings of 8 have outperformed the average stock by a margin of more than 8 to 1 over the next five days. Stocks with Short Term PowerRatings of 9 have outperformed the average stock by an even more impressive margin of 13.5 to 1. Note also the 2-period Relative Strength Index (RSI) values of all four stocks, which reveal them to all be extremely oversold as of Wednesday’s close.
GTX Inc.
(
GTXI |
Quote |
Chart |
News |
PowerRating). Short Term PowerRating 9. RSI(2): 1.91

The Hub Group
(
HUBG |
Quote |
Chart |
News |
PowerRating). Short Term PowerRating 8. RSI(2): 2.77

The St. Joe’s Company
(
JOE |
Quote |
Chart |
News |
PowerRating). Short Term PowerRating 9. RSI(2): 1.84

Superior Industries International
(
SUP |
Quote |
Chart |
News |
PowerRating). Short Term PowerRating 8. RSI(2): 3.31

Tired of losing money trading breakouts and breakdowns? Our special, Free Report, “5 Secrets to Short Term Stock Trading” will show you some of the key strategies and attitudes that traders throughout history have used to determine the right time to buy and the right time to sell. Click here to get your free copy of “5 Secrets to Short Term Stock Trading”–or call us today at 888-484-8220.
David Penn is Senior Editor at TradingMarkets.com.
